Creating visual content can be expensive, time-consuming and difficult to produce. So, why bother?
1. We are suffering from information overload
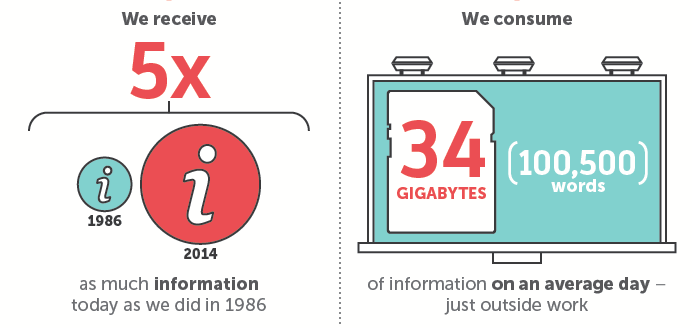
Every day the average person is bombarded with the equivalent of 174 newspapers worth of data. In the middle of this information age, the ongoing increase in data has led to changes in the way users deal with new information.
2. We have less time to make an impact
Research conducted by Microsoft has shown that:
10 seconds
The time you have to clearly communicate your proposition if you want to gain a few minutes of a user’s attention.ii iii

Added to that, data collected by Chartbeat has shown that 55% of users who view a page spend less than 15 seconds looking at it.iv
Those first few seconds are really important. However, you can’t just relax after that.

The graph above is an interpretation of Microsoft’s research by the Nielsen Norman Group.v It shows that the probability of a user leaving your page is greatest in the first 10 seconds – and this probability doesn’t significantly reduce until after 30 seconds.
3. Speed is no longer a technical problem
When it comes to consuming content in our age of information, speed matters.
In the pre-broadband era, users had to deal with a restricted download speed. Under these conditions, plain text and HTML were the fastest way to consume information online.
Nowadays, the average global download speed is 22.05MB on desktop and 11.3MB/s on mobile.vi

Internet speed issues aside, technology has allowed us to move past the need for consuming information as written text. The bottleneck to processing and understanding information now lies in our brains.
4. Our brains process images much faster than text

The invention of the press by Gutenberg in the 15th Century was a crucial element in the popularity of reading and writing. We could argue that the widespread understanding of the written word is only 560 years old, when in 1455 the first mainstream printed book arrived: The Gutenberg Bible.vii
In contrast, the processing of complex visuals can be pre-dated back nearly 300 million years, with the discovery of a fossilised fish, which used colour vision.viii

Visuals are processed faster because they have had the benefit of 300 millions years of evolution.
5. Visuals are already a solution for a real-world problem
Traffic signs are designed to convey all the necessary information in as little time as possible. If they were to rely on text alone, they wouldn’t be fit for purpose.

The second example takes only a few seconds. Why? It’s all down to how your brain processes information. The mechanics of it all can be a pretty complex process to explain, and since this isn’t a dissertation, let’s keep it simple.
A sentence is a collection of symbols, which when combined, conveys meaning.
A traffic sign is just one symbol that conveys meaning.
Put simply, it takes you more time to digest multiple symbols, than it does one.

6. Visuals also help to increase understanding

In a study of learning aids by the Educational Technology Research and Development Journal, the understanding of information jumped from 70% to 95% with the introduction of images.ix
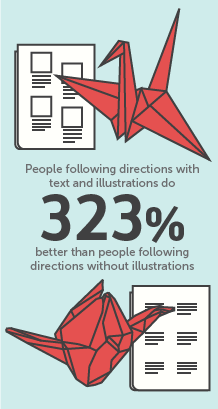
In one of the tests, the group using the text and illustrations did 323% better compared to the group using text-only directions.
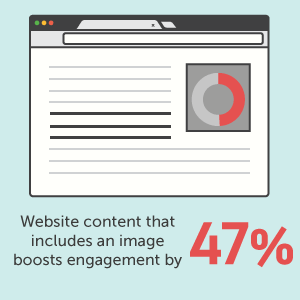
7. Visuals help to improve engagement on a website
According to a study by Curata, the inclusion of an image increased the website click-through rate by 47% when compared to text-only posts.x
As a practical example of this, consider the below:
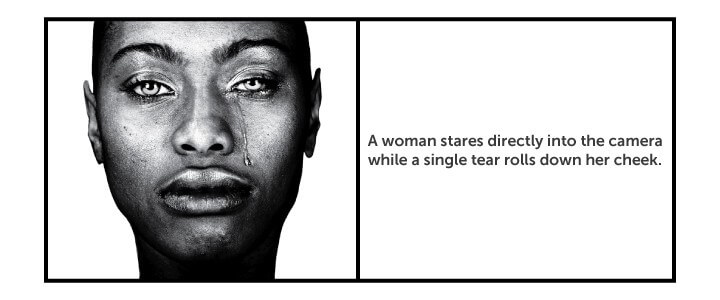
Both are similar in concept – they communicate that a woman is crying – but which did you find more engaging?
8. Visual content improves the Retweet rate on Twitter
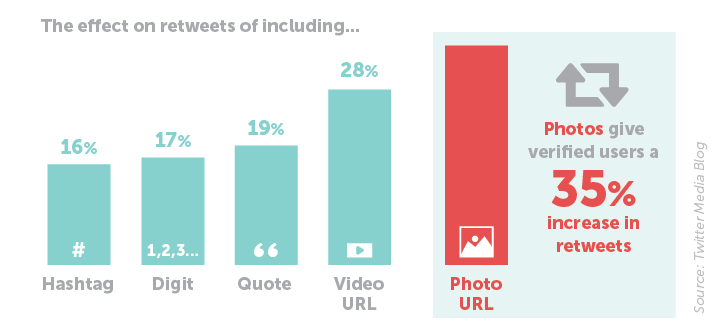
Twitter has released research based on the analysis of over 2 million Tweets in the hope of understanding what fuelled a Tweet’s engagement. According to their findings, the use of image-based content provided a significant increase in the number of people who took action and decided to click ‘share the Tweet’ on their timelines. xi
The most effective Tweet features across all the verified accounts Twitter looked at were photos and videos:
- The inclusion of a video increased Retweets by 28%
- Tweets that included photos achieved 35% more Retweets
9. Visual content increases shares on Facebook
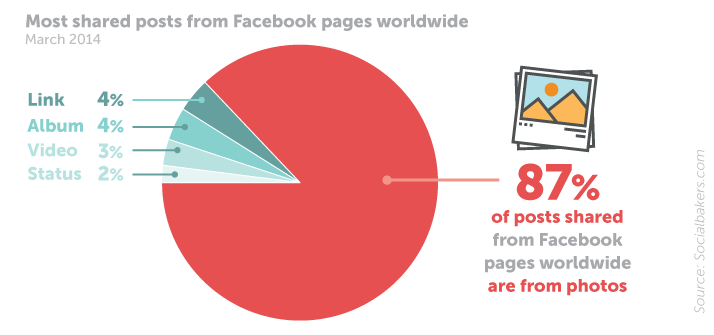
A study published by SocialBakersxii showed that photos took 87% of the share interactions across 30,000 brand pages, with no other content type taking more than 4% of the shares. xiii
10. Visuals make it more likely that users will believe what you are saying
One of the most interesting studies we ran across while writing this article was an experiment in which researchers examined the impact of non-probative information on truthiness.
Participants were given random statements such as “Macadamia nuts are in the same evolutionary family as peaches” for them to respond “true” or “false.” In 50% of cases, images were attached to the statement without necessarily confirming whether it was true or not.

The results showed that participants were more likely to wager a fact was true when it was accompanied with an non-probative photo.xiv
TL;DR
With the massive increase in information we receive, and the corresponding increase in data bandwidth, the biggest hurdle to content marketers now lies in the brains of their audience.
We are wired – through evolution – to process images faster than text, so when we combine written and visual content, there’s a significant increase in understanding.
Content marketing with visuals is already leading to significant improvements in web and social engagement. If we assume that the amount of information we receive is only going to increase, visual content marketing will soon move away from a competitive advantage to a fundamental necessity for any marketer wanting to speak with real people online.
Still not convinced? Check out the infographic below:

Add this infographic to your website by copying and pasting the following embed code:
Photo: Matthew G – Flicker
45 thoughts on “10 Reasons Why Visual Content Marketing Works”
Comments are closed.