

In September 2021, NeoMam Studios turned ten. We didn’t make a big deal out of it, but it was actually a huge milestone for our business.
If you had told us back in 2015 that we would be where we are today, we wouldn’t have believed you. Things were too grim to even consider that we would one day be celebrating ten years in business.
Back then, we were so close to losing everything that focusing on the future seemed impossible – we were 100% grounded in the present in order to survive.
As 2021 comes to an end, I’d like to reflect on where we’ve been before we move on to where we’re going.
Ten years of content people want to share
I didn’t join NeoMam till the end of 2013, so I missed the first two years of the agency.
Well, not quite. I was actually NeoMam’s biggest fan, so I will share part of the story as I experienced it from the outside (weaving in a few bits and bobs I learned once I got on the inside).
October 2011: YouTube Killed TV
Back in 2011, infographics were slowly getting popular. At the time, Danny was a freelance linkbaiter and he noticed an increasing number of publishers featuring infographics. That’s when NeoMam was born.
This is a snippet of NeoMam’s first project:

Check out this project: https://martech.zone/youtube-killed-tv/
By the end of 2011, NeoMam was a team of four working out of Innospace, a business incubator funded by Manchester Metropolitan University.
August 2012: Gangnam Style! The Anatomy of a Viral Sensation
This was the first infographic that seemed to appear everywhere I looked. It was a fun design released at the right time and shared with the right publishers.

Check out this project: https://mashable.com/archive/gangnam-style-infographic
Back in 2012, getting on Mashable was HUGE so anyone building links with content noticed NeoMam that day.
October 2012: Who Do Celebrities Follow On Twitter?
I became an official NeoMam fan when this infographic came out. The piece used a clever methodology at a time when not many were diving deep into social media data.
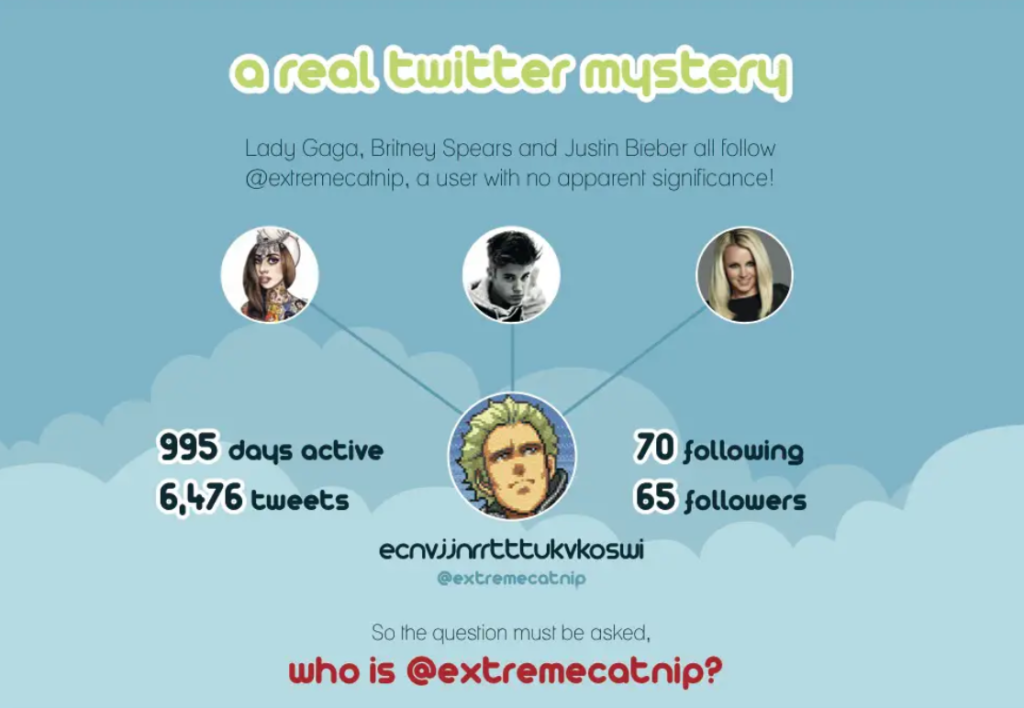
Check out this project: https://www.businessinsider.com/see-who-singers-follow-on-twitter-infographic-2012-10
NeoMam closed 2012 moving out of the MMU incubator and into their first “proper office” in Hulme, Manchester.
January 2013: The Cost of Living on Mars
As a space lover myself, I absolutely loved this infographic (as well as the next one in the series, The Cost of Living on the Moon).
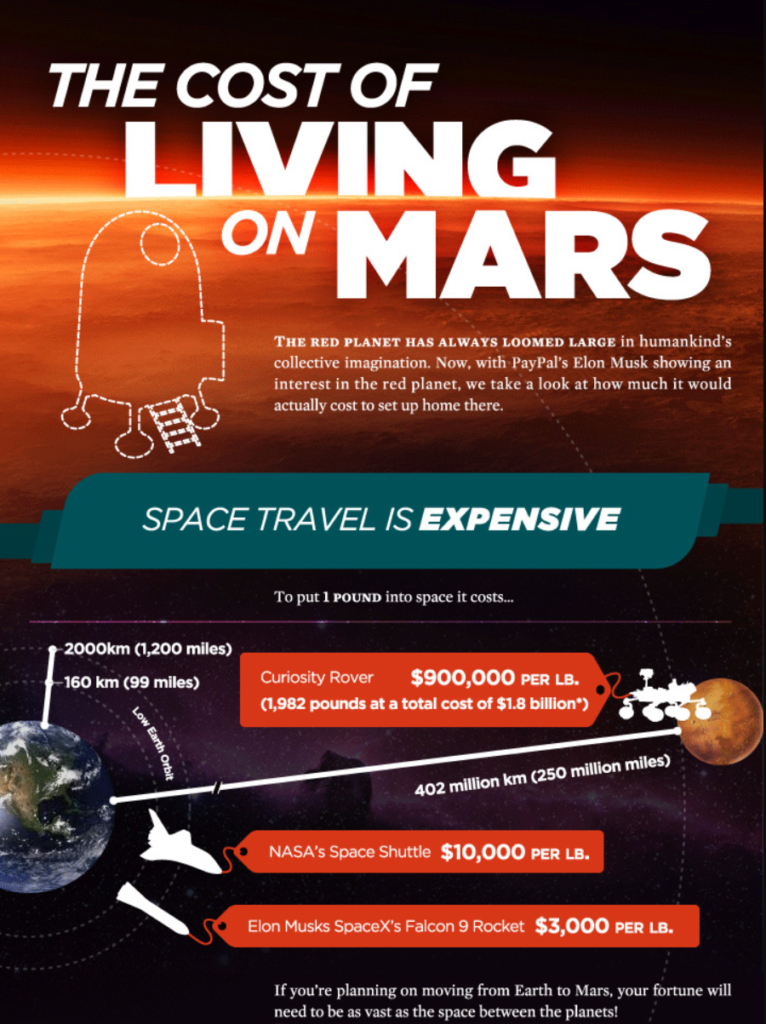
Check out this project: https://www.wired.com/2013/01/mars-infographic/
April 2013: Mining Your iPhone
I still reference this infographic every now and then. It was another one that was everywhere when it first came out.
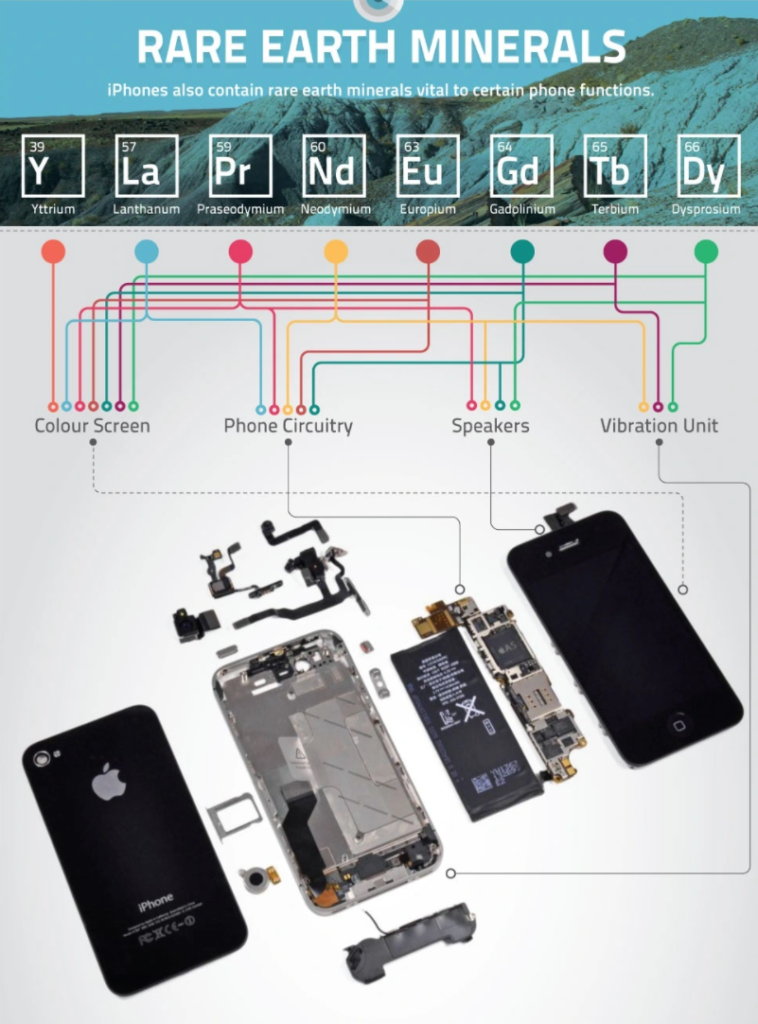
Check out this project: https://venturebeat.com/2013/04/03/mining-your-iphone-recycling-iphones-yields-gold-silver-platinum-and-more-infographic/
This was a project for the oldest client we’ve got on our books, (911 Metallurgist), a client of Danny’s during his days of freelancing that has stuck with us ever since.
July 2013: 13 Scientific Reasons Why Your Brain Craves Infographics
By this point, NeoMam was on most people’s radar. And just to make sure that everyone took notice, they launched what Creative Bloq called “the infographic to end all infographics“.

Check out this project: https://neomam.com/interactive/13reasons/
13 Reasons continues to be linked to and featured in articles about content marketing and information design to this day.
December 2013: How to Disappear Online
This was the first campaign I worked on as part of NeoMam’s outreach team. I had promoted infographics produced by other agencies before but it was never like this. This infographic got everywhere, including TIME magazine, IFLScience, Inc.com and the Daily Mail.
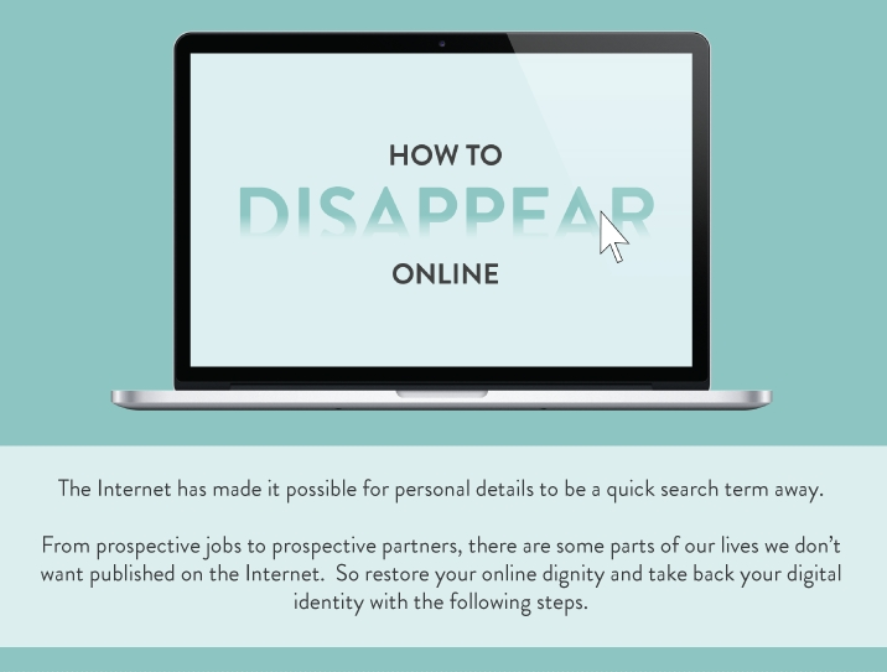
Check out this project: https://lifehacker.com/this-infographic-shows-you-how-to-delete-yourself-from-1536935719
At the end of 2013, NeoMam relocated to a new office in the heart of the Northern Quarter in Manchester. It was a big move; the team celebrated with a party that was meant to be a smallish gathering, but got a little out of hand when the LADbible team (our office neighbours) decided to join.
January 2014: How to Make Towel Animals
This how-to guide prompted the WaPo newsroom to create a snake out of a bath towel.
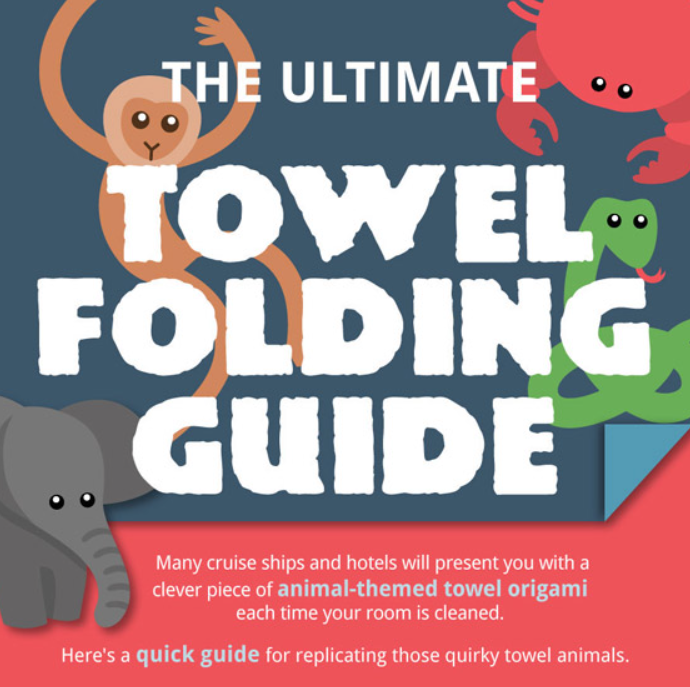
Check out this project: https://www.designswan.com/archives/towel-animal-folding-infographic-ultimate-guide-to-create-your-own-towel-animal.html
The journalist emailed me with photos to share with our team. We couldn’t believe what we were seeing.
May 2014: How Gaming Makes You a Better Person
NeoMam has always had many gamers on the team, so we loved the chance to explore the cognitive benefits of gaming.
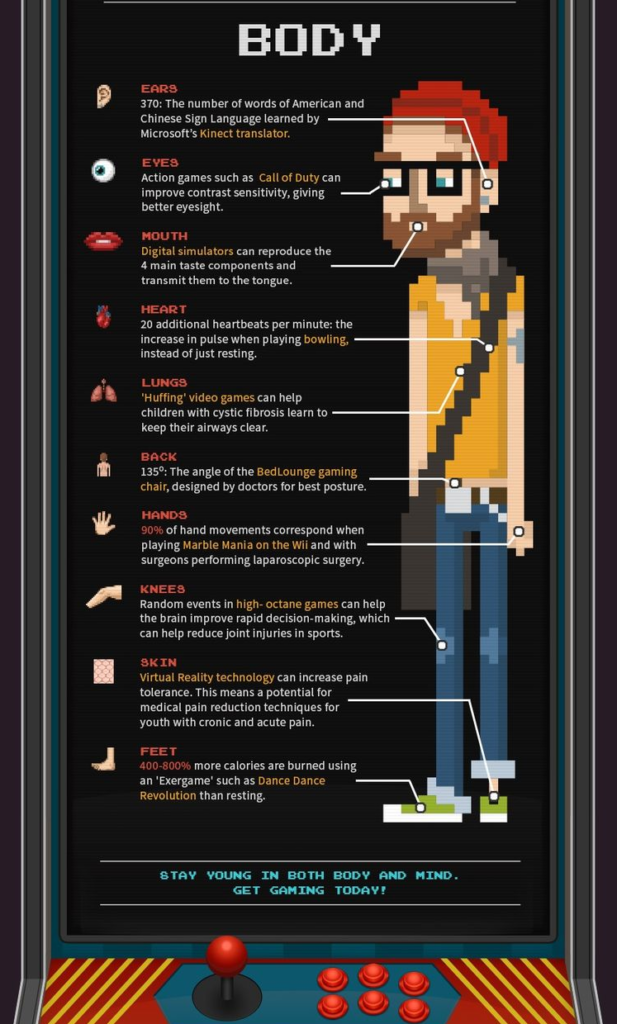
Check out this project: https://www.makeuseof.com/tag/12-ways-gaming-makes-better-person/
We used to have an arcade machine at the office and I can now see how much it inspired the designers who worked on this infographic.
July 2014: The Vegetable Growing Cheat Sheet
I couldn’t write this post without mentioning this cheat sheet. We love running into it on Reddit pretty much every year since we launched it: https://www.google.com/search?q=Vegetable+Growing+Cheat+Sheet+site%3Areddit.com
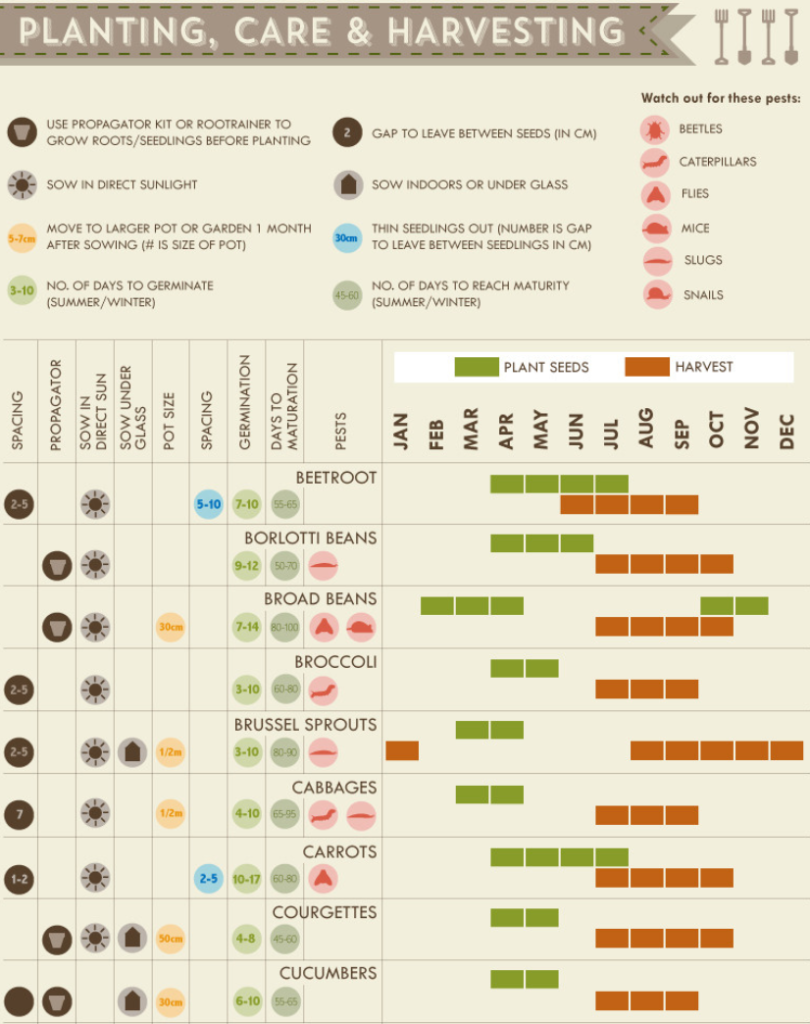
Check out this project: https://www.huffpost.com/entry/growing-vegetables-home-garden-cheat-sheet_n_5630136
September 2014: How to Become a Google Power User
Another one that still gets shared regularly on Reddit 😀 I wonder how many people have learned about search operators and features with the help of this infographic.
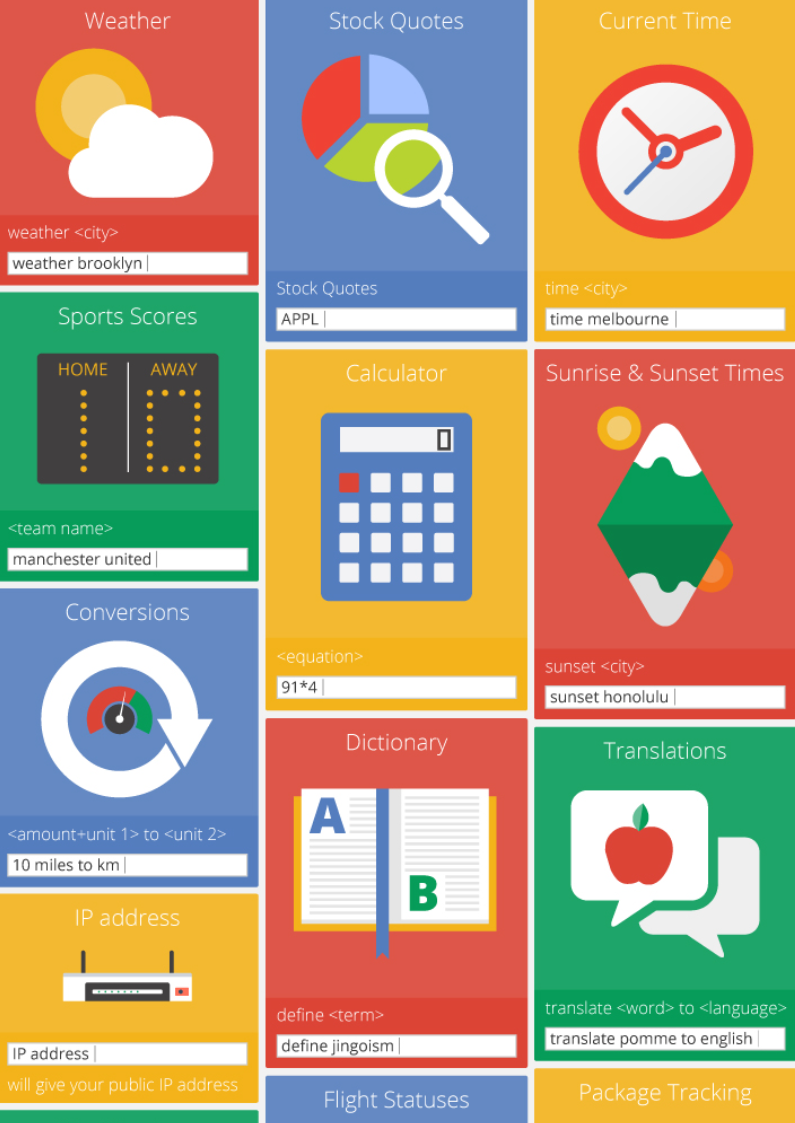
Check out this project: https://blog.hubspot.com/marketing/google-search-tips
By the end of August 2014, the NeoMam team had grown to 27 people. Every week there was someone new joining or a new job ad being posted. It was exciting to see.
October 2014: A Traveller’s Guide to Tap Water
This was a project we had to buy off our client. Yes, you read that right.
When we tested the infographic on Reddit, it caused a lot of controversy as many people disagreed with the rating given to their local tap water. However, it wasn’t us saying their water was unsafe, it was the CDC. Sadly, the client was ready to kill the project so we had to pay for it to get it back – we wanted to release it because we were totally confident in the content and the potential of the campaign.
And we were right. This infographic killed it in terms of coverage, with journalists feeling comfortable enough to defend the data when their readers argued against it.
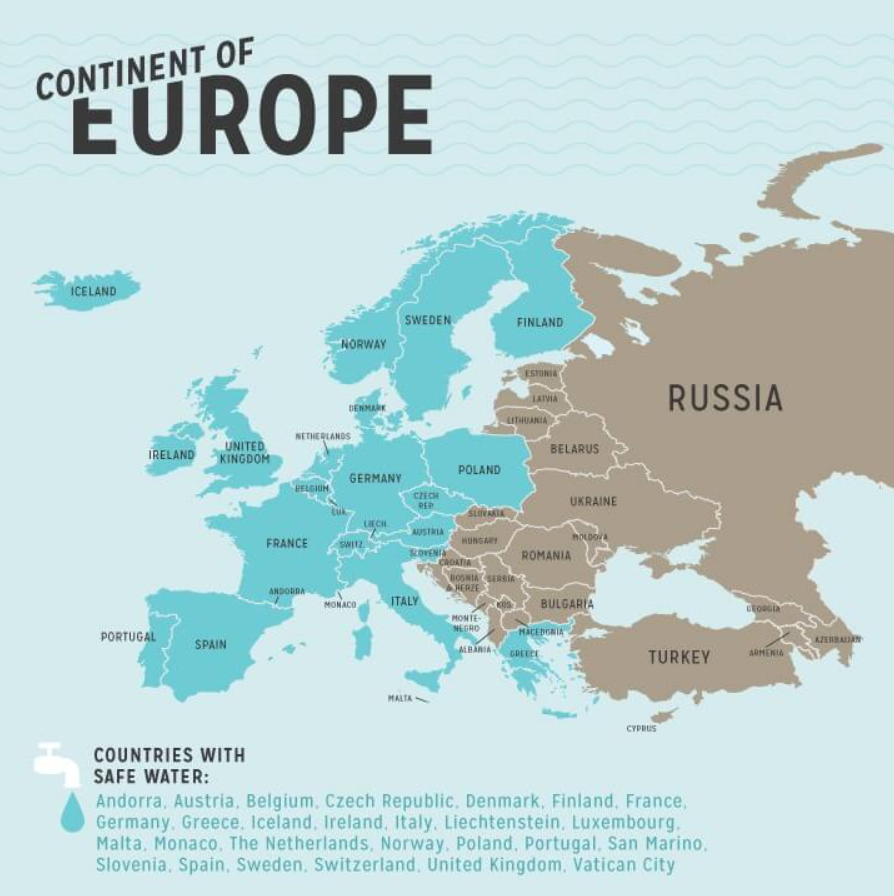
Check out this project: https://matadornetwork.com/read/travelers-guide-tap-water-infographic/
It’s worth mentioning that by this time, we were in deep financial trouble:
- Our biggest client had put a hold on new projects
- Sales had slowed down as they usually did around the Holidays
- We had bought out one of the directors and our cash reserves had taken a hit
I personally didn’t know any of this yet, nor did the rest of the team. The directors had decided to keep this information under wraps so we wouldn’t worry about it.
We kept working. It was business as usual.
January 2015: Google Trends Tracker Map
The first time Jonny (our former head of interactives, now operations lead) showed me this project, I was in awe. Hooking up an API to an interactive 3D globe which pulls in new data on a daily basis (and is fully customisable) might seem like a simple thing today but it wasn’t back then.
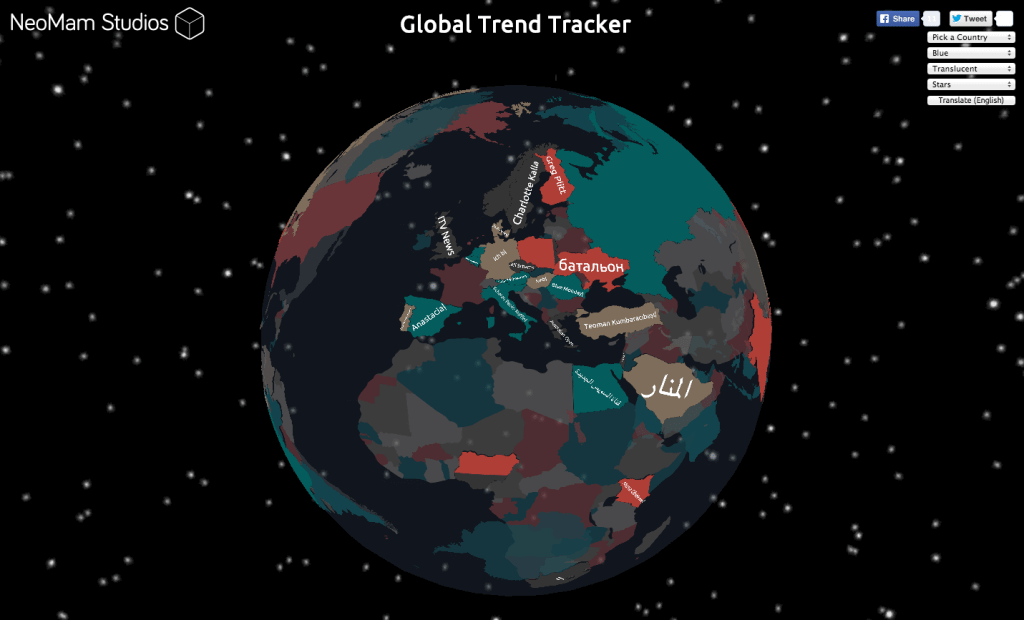
Check out this project: https://neomam.com/interactive/trendmap/
The Huffington Post embedded the globe into their homepage and the amount of requests ended up taking down our servers. Danny had to get on the phone and upgrade our hosting just to get the globe (and our website!) back online.
March 2015: Is Your Favorite Website Spying on You?
Privacy concerns were growing so we jumped into the topic to uncover the websites tracking their users the most.
These days, most sites make this information easily available and in a digestible format, but back then we had to use a series of browser extensions to collect the data manually.
Check out this project: https://www.visualcapitalist.com/favorite-website-spying/
By March 2015, we had gone through the most difficult month in the history of our business. The directors called for a meeting with all managers where we spent the entire morning trying to trim £40,000 off our monthly expenses to protect us from going under by the end of the month. We trimmed all the fat and every “nice to have” we could but it got to a point where we had to consider making people redundant.
The process ended with several people losing their jobs. The team members who kept their jobs couldn’t understand what was happening around them. By trying to protect everyone from the situation at hand, we had lost their trust forever.
April 2015: How Vinyl Records Made Their Comeback
By April we were all focused on three things: bringing in new business, spending as little money as possible, and delivering amazing work for our clients in the hopes they would move to a new retained agreement model.
This infographic is an example of everyone in the team working together and pushing in the same direction.
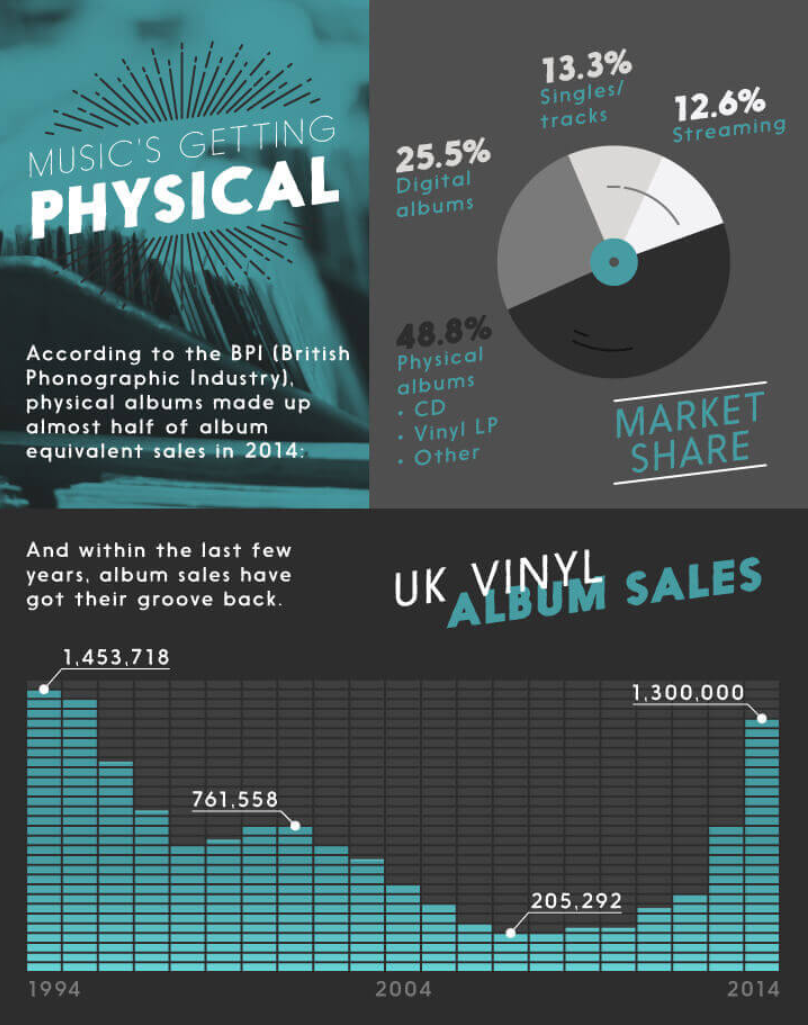
Check out this project: https://www.hypebot.com/hypebot/2015/06/a-brief-history-of-vinyl-musics-unlikely-comeback-infographic.html
June 2015: Around The World In 31 Coffees
This was one of those that prompted journalists to call our office asking for the press pack. It was a simple idea, executed flawlessly.
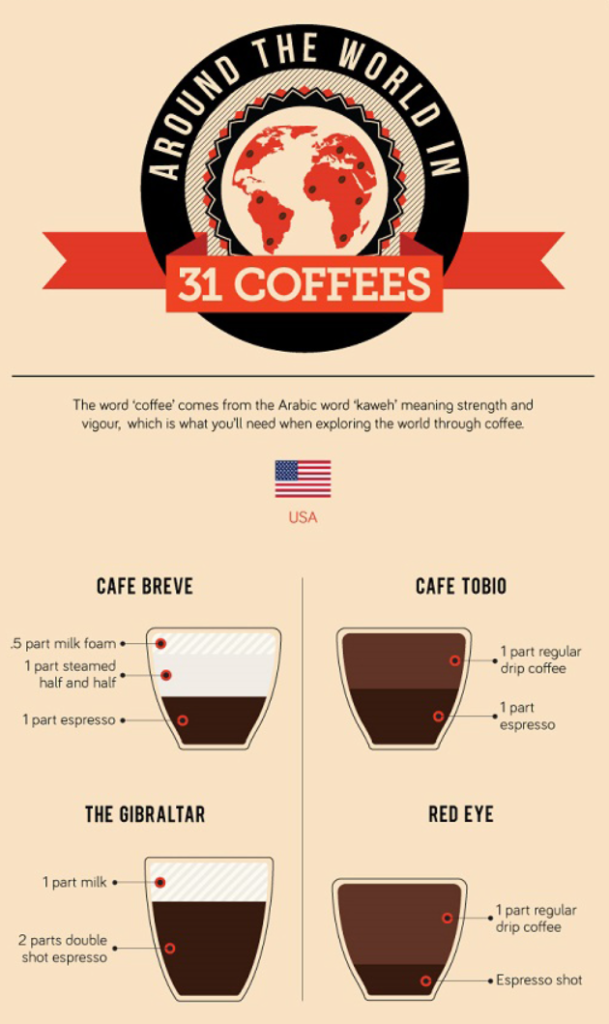
Check out this project: https://www.mic.com/articles/106034/finally-the-ultimate-travel-guide-for-coffee-lovers
Sadly, as much as the content and the results were great, the day-to-day at the office was not.
The team became divided into various cliques. Everyone was still hurt by the decision to let go of people, and there was no trust. The majority of the members of the team wanted to leave NeoMam, and were either looking for jobs or waiting to be fired.
October 2015: How Much is Your Coffee Addiction Costing You
This infographic is an example of what Danny calls “a visual answer to a question”. The content producers would explore a topic from different angles till they were ready to answer the question.
Every UK newspaper covered the findings of this study – from The Telegraph to Metro.
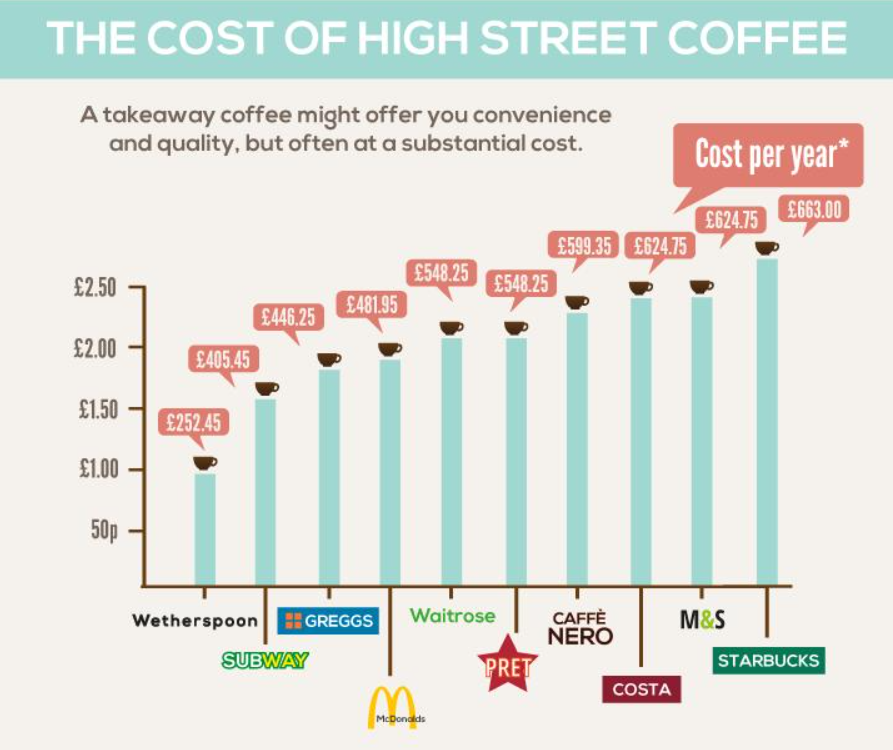
Check out this project: https://www.buzzfeed.com/alanwhite/heres-how-much-your-addiction-to-coffee-is-costing-you
October 2015 marked eight months since we had started implementing The Great Game of Business system with the help of an amazing consultant called Arend Welmers. Arend was with us through it all, supporting us as we made the first steps towards reinventing our business.
I don’t think we would have had the strength and clarity to make the tough decisions we had to make without Arend, so I want to publicly thank him for all his help and advice.
January 2016: 10 Ways to Fall Asleep on a Plane
This is one of my favourite infographics we ever made; a simple idea, executed to perfection.
The research is solid, the copy is tight, and the design keeps you hooked:
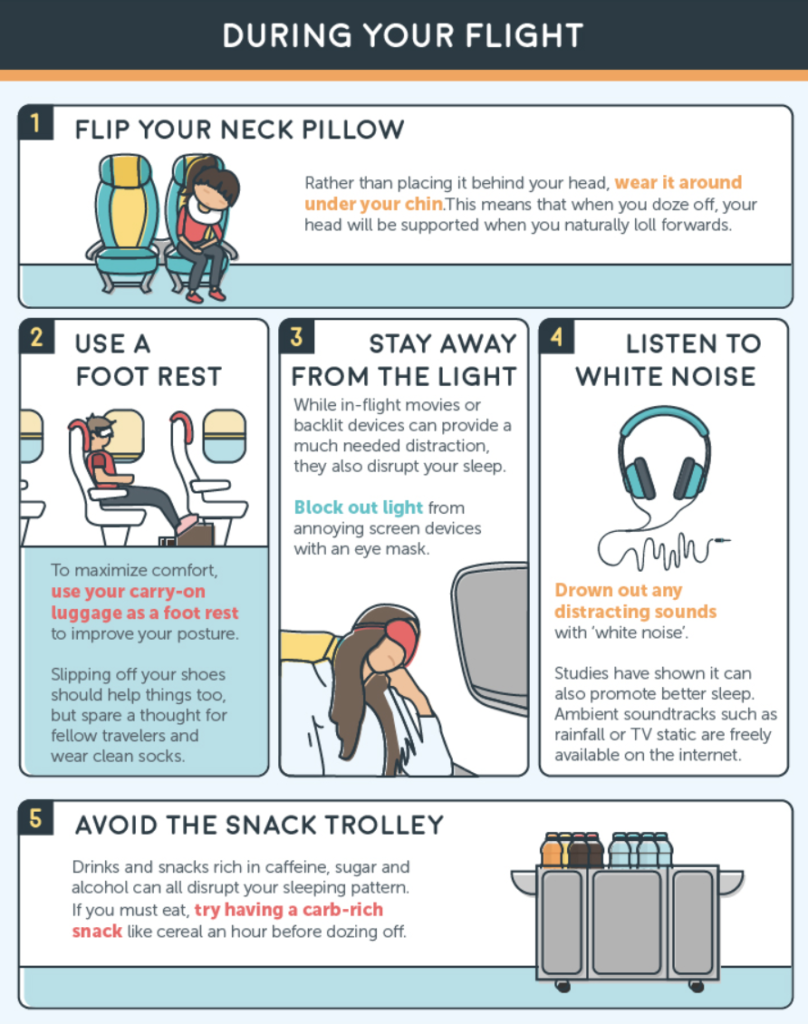
Check out this project: https://www.huffpost.com/entry/sleep-on-plane-tips_n_55d5dbf6e4b07addcb45a1d9
We started 2016 with a handful of team members leaving NeoMam. What was once a team of 30 people had shrunk to a team of nine.
By this point, we had started self-implementing the EOS system. This was the beginning of the NeoMam we are today.
July 2016: How to Pet-Proof Your Garden
It might look like a simple piece of content to you but it means a lot more to us.
This was the closest thing to a pitch scenario we’ve ever taken part of. Two agencies, two campaigns, one client. We went head to head with one of the most well-regarded content marketing agencies in America, and we won. In the end, we secured a relationship with one of our longest-standing clients.
Check out this project: https://www.huffpost.com/archive/au/entry/clever-tips-for-pet-proofing-your-garden_a_21448505
August 2016: The Peak Time of Day for Everything You Do
This is a very special piece of content because it was the first campaign that Luke (our former account manager, now head of outreach) launched and promoted.
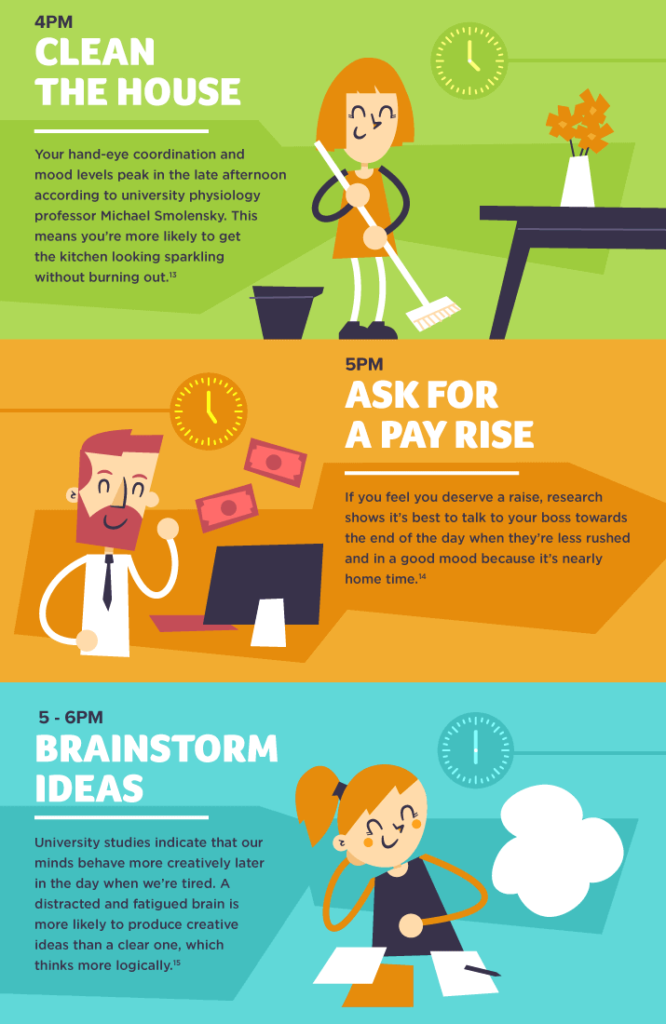
Check out this project: https://blog.hubspot.com/marketing/best-time-of-day-activities
Luke made the move from account management to outreach a few months after launching that campaign, and he’s not looked back.
October 2016: 8 Floor Plans From Iconic TV Homes
Another one of those that took over the web for at least a week. This was the first time we created floor plans as our main asset for a campaign.
We wanted to be as accurate as possible so we enlisted the help of an architect (the amazing Jelena), who has supported us in multiple architectural projects since then.
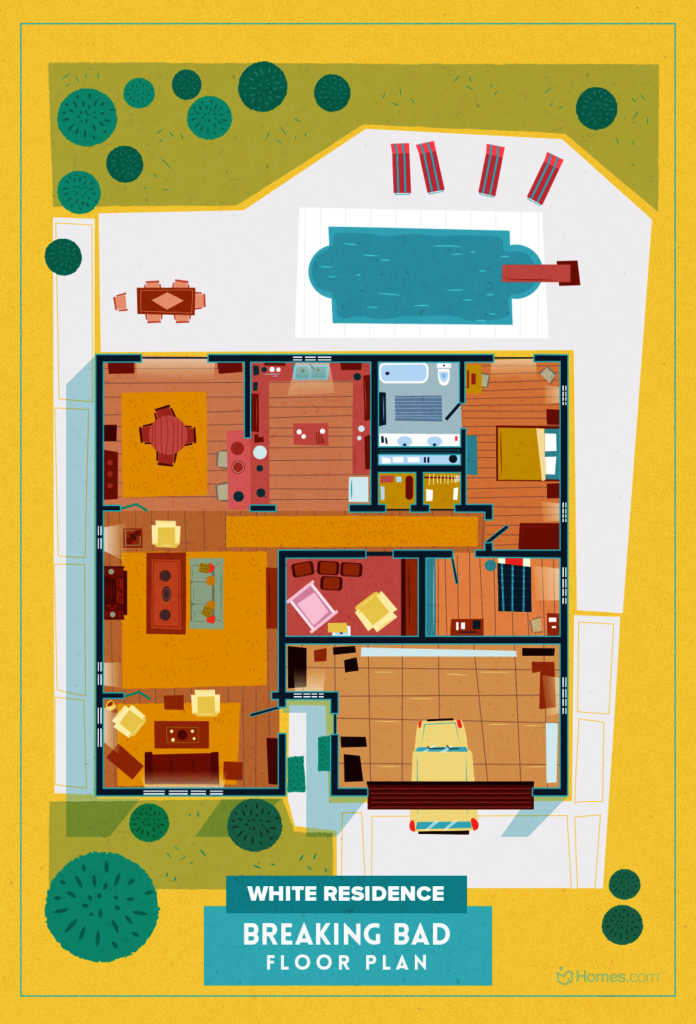
Check out this project: https://www.inman.com/2016/11/16/8-floor-plans-homes-beloved-cult-tv-shows/
October 2016: 7 Vehicles to Survive the End of the World
This was our first attempt at creating realistic renders for a project. We have learned and improved a lot since then, so I like to come back to this project just to see how much we’ve grown.

Check out this project: https://www.driving.co.uk/news/seven-doomsday-cars-get-impending-apocalypse/
November 2016: 9 Natural Ways To Cure Jet Lag
Another super simple idea that was executed well and achieved great coverage. It landed on Business Insider, Inc. Magazine, Lifehacker, MyModernMet, and The Daily Beast, just to name a few.
Check out this project: https://www.businessinsider.com/how-to-cure-jet-lag-2016-9
However, the most exciting piece of coverage came when our forever agency crush, Column Five, included the infographic in their roundup of The 45 Most Creative Infographics of 2016 – alongside eight others by our team!
January 2017: Five iCar Concepts Based On Iconic Apple Products
This project truly felt like a new beginning for us.
Check out this project: https://www.motor1.com/news/134637/apple-car-classic-renderings/
By January 2017 we had a clear vision of who we were as a team and where we wanted to go as a business. Sadly, the journey that brought us to this point also meant the majority of the old team was no longer a part of NeoMam.
June 2017: The Literal Translation of Places in Canada & the United States
If you follow our work these days, you’ll know that we love making maps. This love has always been there 🙂
This project was the predecessor of our Literal World Map:
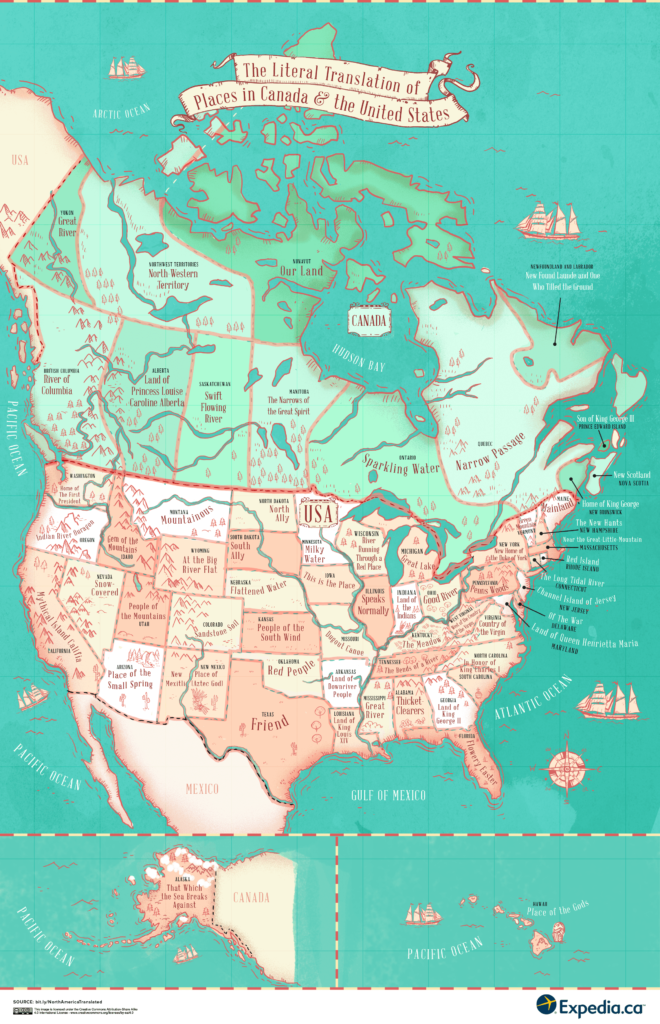
Check out this project: https://www.mentalfloss.com/article/639795/name-meanings-us-states-canadian-provinces-map
At this point the majority of our team was not based in the UK, and the three directors were heavily involved in every project: Danny came up with every idea, Amy was briefing and editing every project, I was working with the designers and pitching content every day. We had rolled up our sleeves and focused on rebuilding our business from the ground up. Now it was time for phase two.
NeoMam went remote in June 2017. The email from Amy explaining our decision read, “the goal is to move to a simpler way of working, improving accountability and clarity of responsibility.” Our theory was that going remote could help us build the business we wanted to build.
After years of reading the advice from the Buffer team and wishing we could run a remote team too, it was time to just give it a go.
We never looked back.
November 2017: The Simpsons Home In 8 Popular Architectural Styles
Our first “Simpsons project” 🙂
We have tapped into The Simpsons multiple times since then because we found they are the perfect vehicle for us to introduce readers to new concepts.
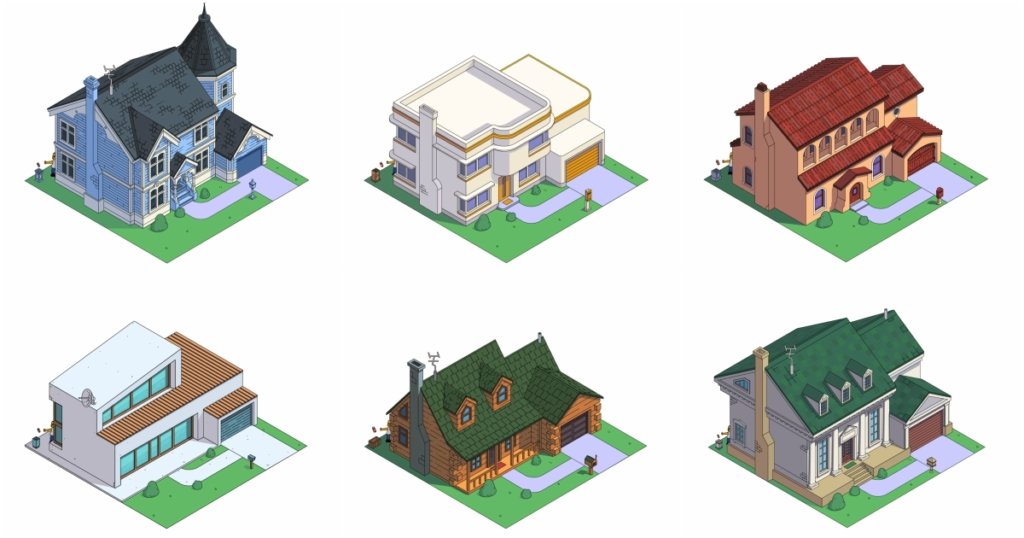
Check out this project: https://mymodernmet.com/simpsons-home-architecture-styles-neomam/
This was a pivotal project that taught us what was possible to achieve in the intersection of pop culture and education.
March 2018: The Literal Translation of Country Names
This one made the front page of Reddit while we were testing it before launch. It forced us to reach out to hundreds of websites asking them to 1) credit the content to the client instead of Reddit, and 2) replace the images with the updated maps, including all the improvements we had made after going through the redditors’ feedback.
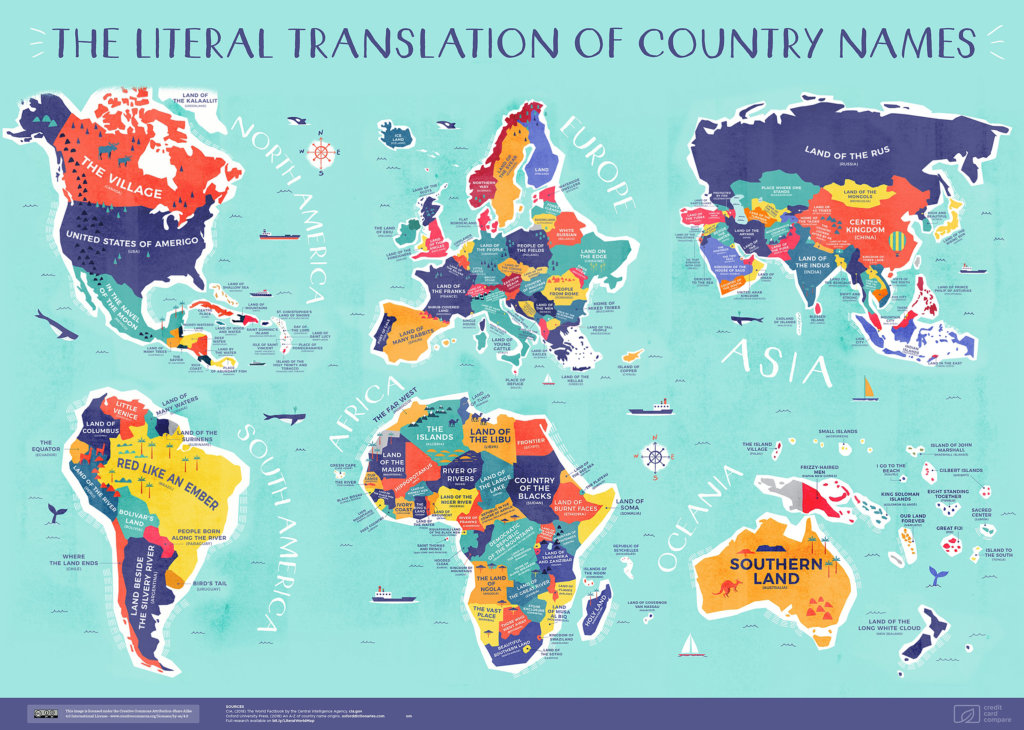
Check out this project: https://www.visualcapitalist.com/mapped-the-literal-translation-of-every-countrys-name/
What a nightmare.
April 2019: 7 Ancient Ruins Around The World, Reconstructed
At the same time, we were chasing what seemed like every website on the web to credit the Literal World Map back to our client, we had another project that made the front page of Reddit.
This wasn’t just any project; it was our first set of reconstructions.

Check out this project: https://metro.co.uk/2018/03/29/gifs-returning-crumbled-ancient-ruins-back-former-glory-7425445/
Since then, we have rebuilt a number of lost architectural wonders. Someone made a thread of most of them recently, it was awesome to see so many people loving the work:
Ancient ruins ‘reconstructured’. Thread
— Joaquim Campa (@JoaquimCampa) September 15, 2021
1. The Parthenon
Athens, Greece / 432 BC pic.twitter.com/3ZsLS290mm
July 2018: If 7 Film Directors Designed Travel Posters
Random people have shared this one with me over the years not knowing it was created by our team. I love it when that happens.
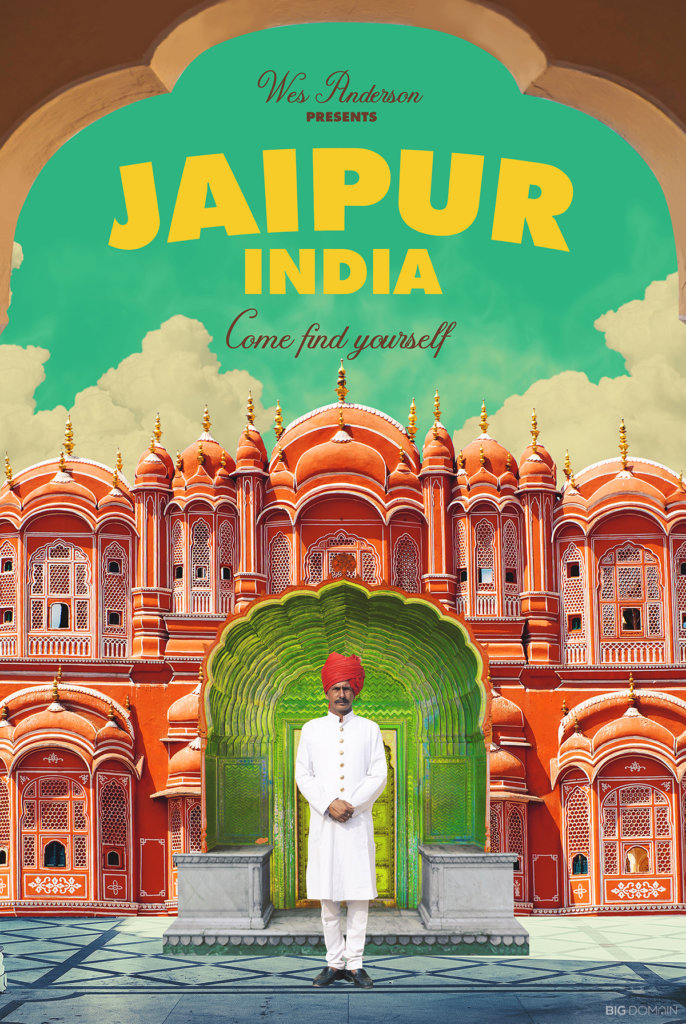
Check out this project: https://www.lonelyplanet.com/articles/travel-posters-famous-directors
August 2018: The Average Face of a Vogue Cover Model
2018 was the year when we were seriously pushing ourselves out of our comfort zone when it came to executions. We even had a measurable in our company scorecard connected to how many new formats/methods we had tested.
This project wouldn’t have happened had we not pushed ourselves outside of our comfort zone like that.
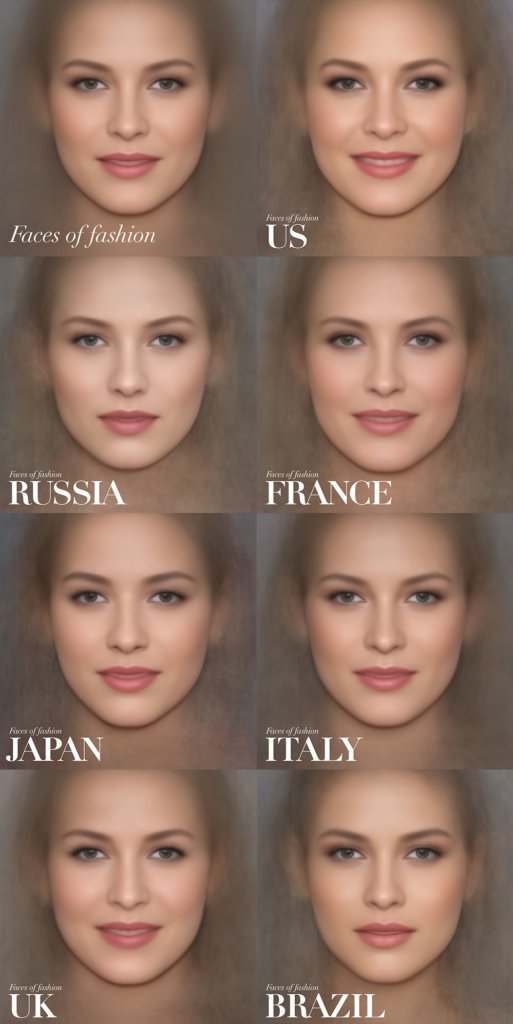
Check out this project: https://www.independent.co.uk/life-style/fashion/vogue-cover-model-average-face-study-us-russia-france-japan-a8482356.html
November 2018: What Central Park Could Have Looked Like
I’m so proud of being able to say we created this piece of content. We had a vision, we did our research, and we went for it.

Check out this project: https://www.atlasobscura.com/articles/forgotten-design-for-central-park
In November 2018 everyone on the team met for the first time IRL. We spent a week together in a beautiful manor house outside York, playing VR games, working on our laptops by the fire, and enjoying good food together. This was the first team retreat.
December 2018: Most Scenic Drives in America, Pixel Art Style
We had a lot of fun working on this project even though we were reaching the end of our relationship with Expedia.
Whenever we are closing the cycle with a client, we always want to leave them on a high note. This project got both teams super excited:
Check out this project: https://www.designboom.com/art/neomam-expedia-8-bit-scenic-drives-america-02-24-2019/
Ending our relationship with Expedia was one of the hardest decisions we had to make. It was the first time we walked away from a client we had been working with for many years, so it set the precedent that it can be done on good terms.
February 2019: What 6 Rooms From Famous Paintings Would Look Like In Real Life
When Povilas (our art director) pitched this idea, we were instantly hooked.
Our strategy for this client was built around introducing new sources of home design inspiration, so this project hit that brief beautifully.

Check out this project: https://www.artsy.net/article/artsy-editorial-rooms-6-famous-paintings-today
July 2019: Fossil Fuel Production by Country, Mapped
This was another project that pushed us outside our comfort zone, and that made us better content creators because of that.

Check out this project: https://www.weforum.org/agenda/2019/06/mapped-fossil-fuel-production-by-country
Danny shared this project in a LinkedIn post that sparked good conversation around the topic of data visualisation which is worth a read.
September 2019: 100 Years Of Gender Neutral Names In America
This was one of the biggest data-led projects we had undertaken up to that point in NeoMam’s history.
We knew we wanted to analyse 100 years worth of data from the Social Security Administration to identify the most popular unisex names in every state over time. What we didn’t know was how to do it.
Cue Sam, our systems developer. For the first time in his many years working at NeoMam, Sam got involved in production and created a series of scripts to help us sort, analyse and clean up 100 years of baby names.
Check out this project: https://www.thebump.com/news/gender-neutral-names-last-decade-by-state
These days Sam has a hybrid role where he occupies two seats in our accountability chart: one within operations as our sys dev engineer, the other as a data scientist within the production team.
November 2019: The Real Value of the Queen’s Crown
Back in September 2019 we came up with the idea of estimating the value of the Queen’s crown. Our initial plan was to enlist the help of a jeweler who could appraise the different gems and metals. Two weeks into research, we found that every jeweler we approached was hesitant to put their name behind a valuation.

Enter James, our content team lead. Using historic records, James was able to identify every single gem and metal that makes up the Queen’s crown. He then used gem size and valuation guidelines from the International Gem Society and consulted the catalogue of the Queen‘s official supplier of fabric in order to estimate the value of every element that makes up the crown:
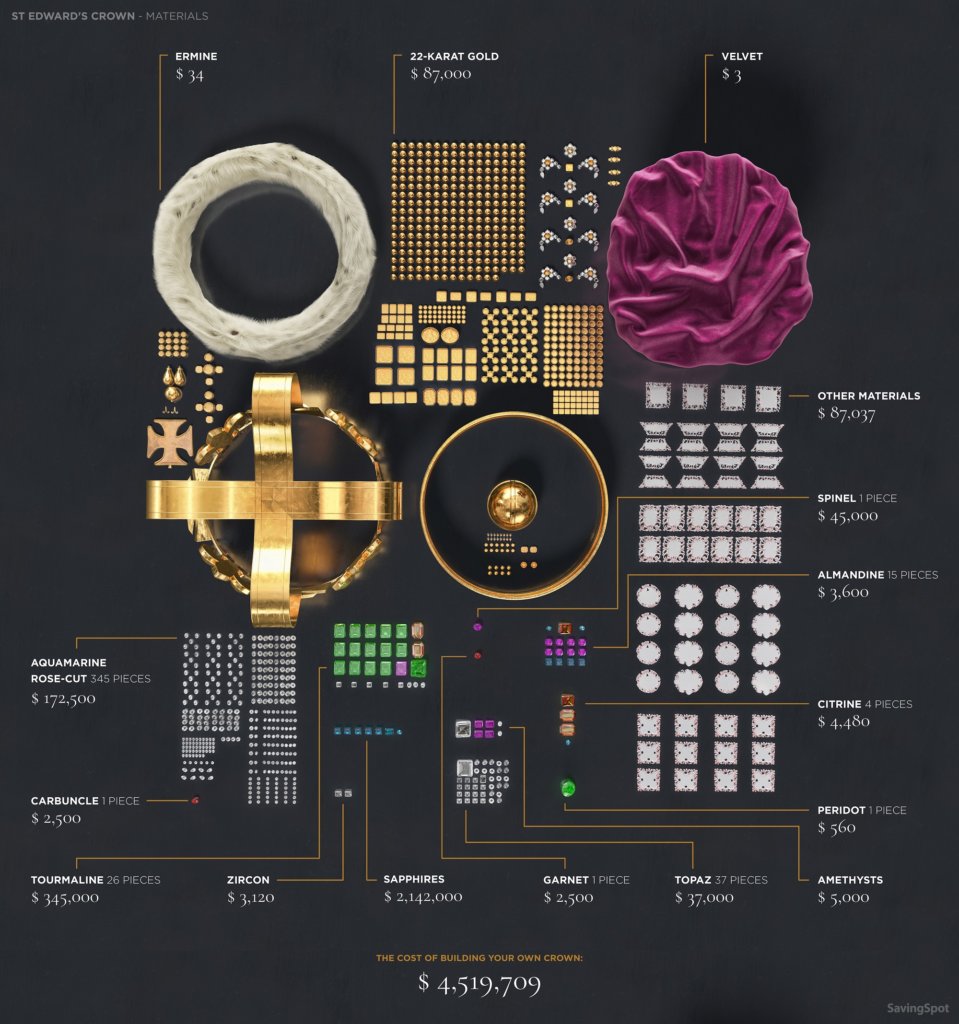
Check out this project: https://www.mentalfloss.com/article/605588/queen-coronation-crown-value
The promotion for this project started a few weeks before we all packed our bags and headed to Thailand for our second team retreat. This was the last time we were all under one roof – both the 2020 and the 2021 retreats were canceled due to the pandemic.
February 2020: The Oldest Company in Almost Every Country
I’ve said it before and I’ll say it again:
“When I think of NeoMam content, I think of this map: we made a thing that will continue to get referenced and shared around the web for years to come.”
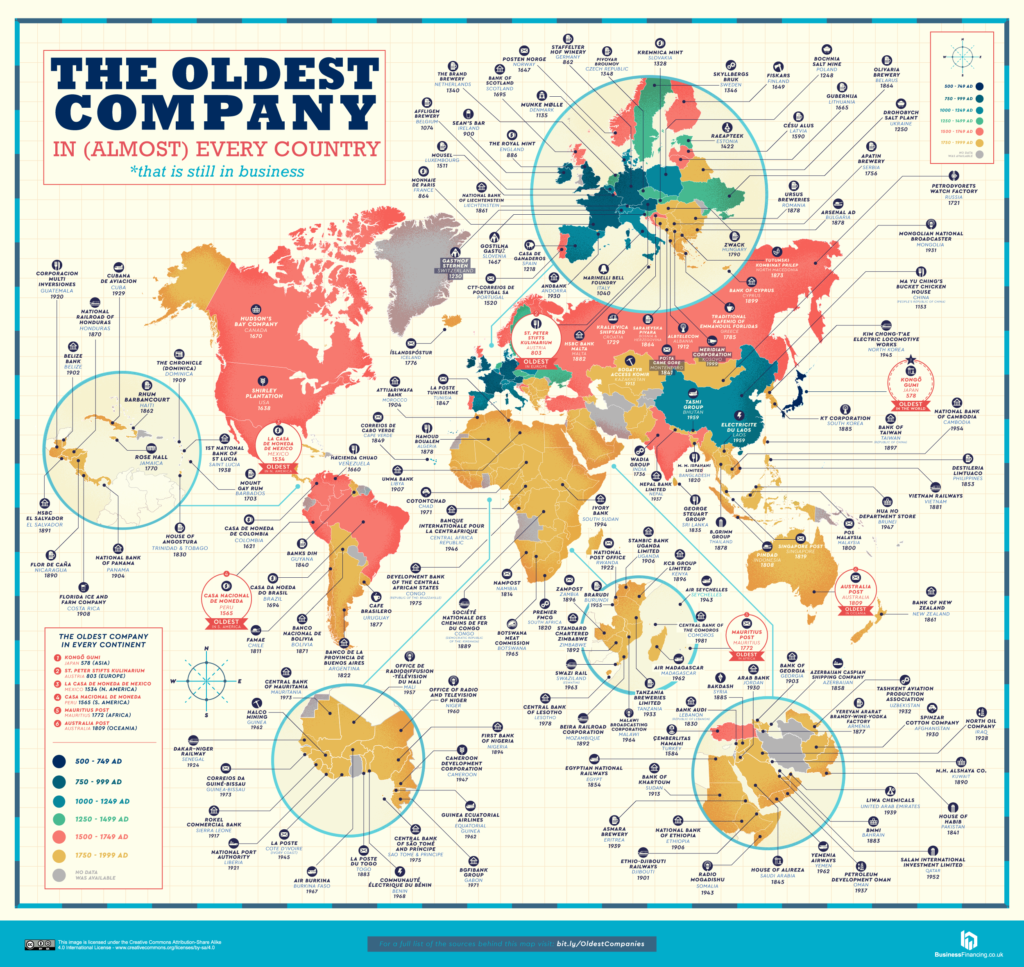
Check out this project: https://bigthink.com/strange-maps/oldest-companies/
As we moved away from this campaign, Covid-19 had been declared a global pandemic. Every person on the team was on different timelines when it came to number of cases, lockdown, measures and advice.
At first, the one thing we all had in common was fear. Later down the line, we all shared the feeling of gratitude for being a remote team.
August 2020: Pop Culture Polly Pockets
To this day we get emails from people looking to buy these. Maybe one day we will be able to make them, who knows…
Check out this project: https://mashable.com/article/polly-pocket-the-simpsons-stranger-things-friends/
So much work went into the creation of these fictional Polly Pockets! It started with a careful curation of the right mix of TV shows and movies. Then, the team moved to picking the different home elements that would be included in each Polly Pocket. Once that was done, there was a lot of sketching and tweaking before any 3D modeling was done. Through it all, our art director (Povilas) made sure each design would be instantly recognisable.
October 2020: The Simpsons x Wes Anderson
We love working with The Simpsons as our canvas. We use them as a point of reference when we want to teach something to readers, so we’ve done A LOT with their house whilst working with our home clients.
In this case, however, we wanted to inspire by tapping into Wes Anderson’a iconic interiors.
Check out this project: https://www.nme.com/news/tv/the-simpsons-locations-get-wes-anderson-style-makeover-2799013
These mashup projects are super fun but also incredibly challenging. Each of the rooms in this series went through a number of feedback rounds till we felt we had truly nailed the marriage of Wes Anderson and The Simpsons.
The main reason why I picked this project is because it was the first project with Jaz (our former design team lead) offering creative direction to the design team. It was a huge pleasure to see her in action.
November 2020: Twitch-onomics
A few weeks before launching this campaign the leaderboard in our study changed. At record speeds, the team had to update the data + recalculate the ranking + update the designs + rewrite the accompanying blog post.
But that is not why this is a project to remember. This is one for the books because Taylor (our senior outreach specialist) worked with a journalist from The New York Times who referenced (and linked out to) the study in one of his articles.
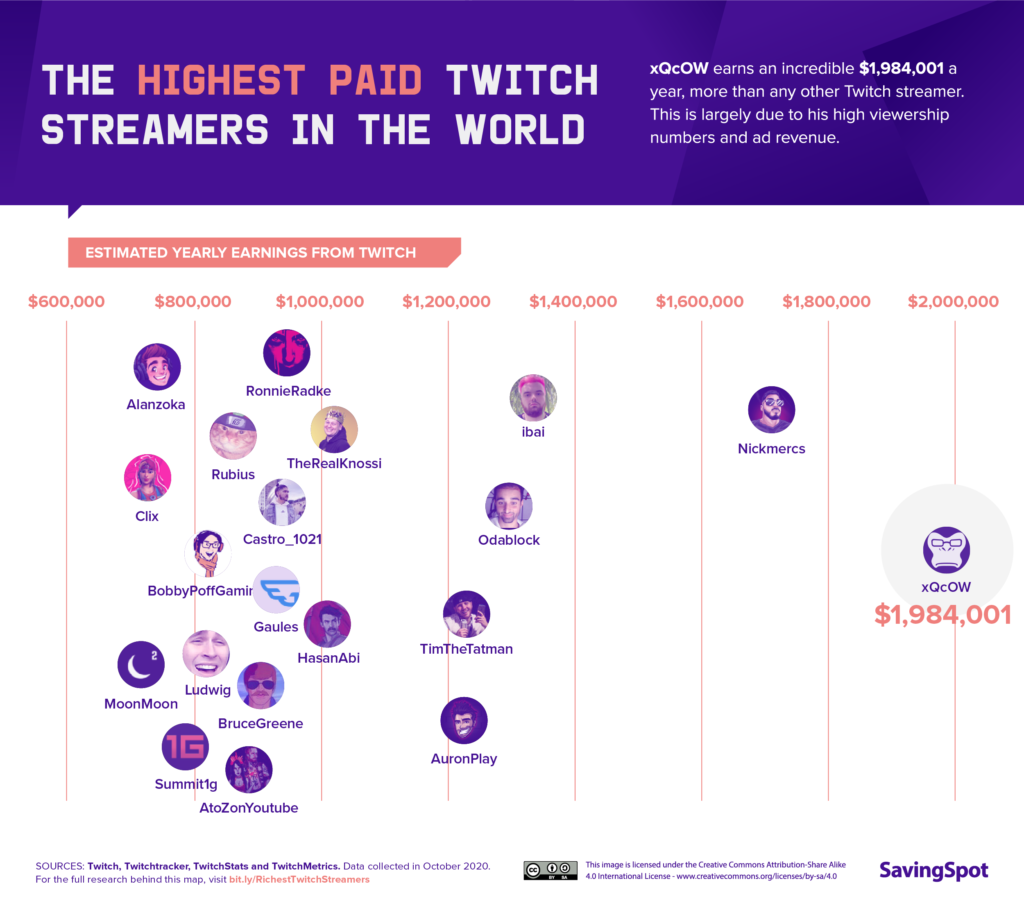
Check out this project: https://www.dexerto.com/entertainment/how-much-did-top-twitch-streamers-make-in-2020-nickmercs-xqc-more-1451235/
December 2020: Surveillance Cities
This was one of the first ideas from Barnes (our senior creative) that went into production. And it was such a Barnes’ idea…
Barnes has a knack for asking questions and looking for what’s missing. Others had explored the topic of surveillance in cities but he wondered something that was nowhere to be found: “I get it that these places have the most cameras but considering the size of cities differs so much, I wonder which city has the highest concentration of cameras per kilometer square… “
So we gathered the data, did the math, and uncovered the most heavily surveilled cities on the planet.
Check out this project: https://www.visualcapitalist.com/mapped-the-top-surveillance-cities-worldwide/
This was our last campaign of 2020.
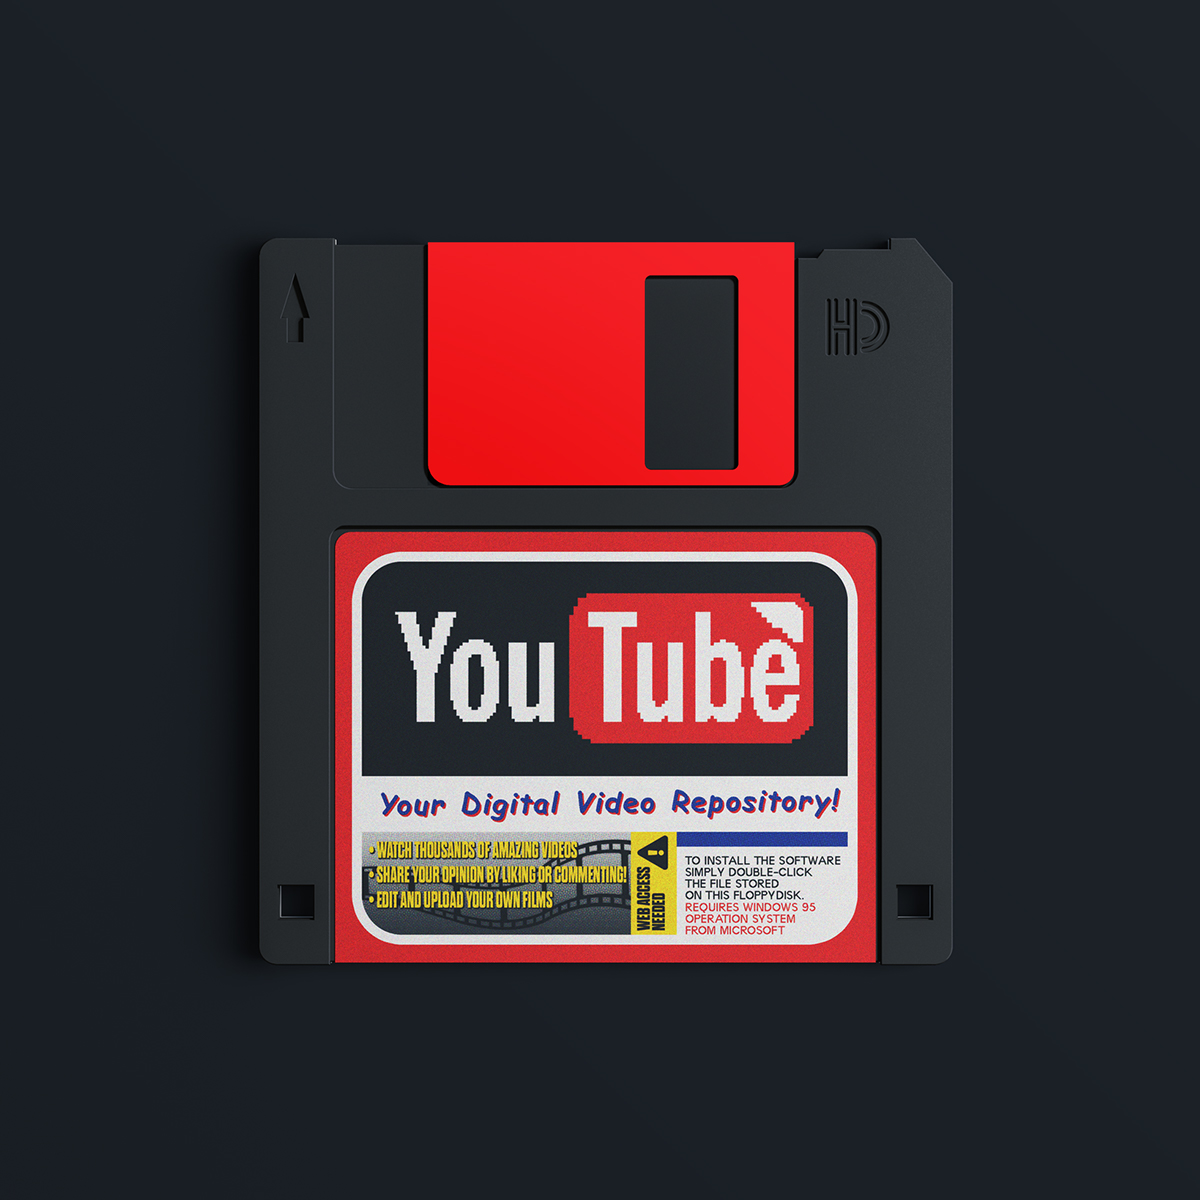
April 2021: If 8 Popular Websites Existed In The 90s
If you can’t reimagine the web’s most popular websites for a website builder, then who can you do it for?
Check out this project: https://www.printmag.com/graphic-design/zyro-s-90s-inspired-redesigns-for-your-favorite-social-websites-are-deeply-nostalgic/
I assigned myself as the content producer for this project because I knew I could nail the shortlist, the pairings, and the Easter Eggs.
The only reason I would allow myself to jump into a project like this is because of our third core value: we are hands-on.
For the longest time we fought the feeling we sometimes get that tells us we would be the best person for the job. But the moment we embraced it, it supercharged us.
Everyone at NeoMam will be hands-on at some point, and it’s okay, in fact, it’s a great idea to get involved in something we know we can do a great job on.
July 2021: What the White House Could Have Looked Like
Earlier in the year Danny found out that a few of the runner-up proposals for the White House design competition were being stored at the Maryland Center for History and Culture.
It took multiple emails and trips to the archives but eventually we received the digitised versions of these proposals. For the first time ever, we could show the world what the White House might have looked like.
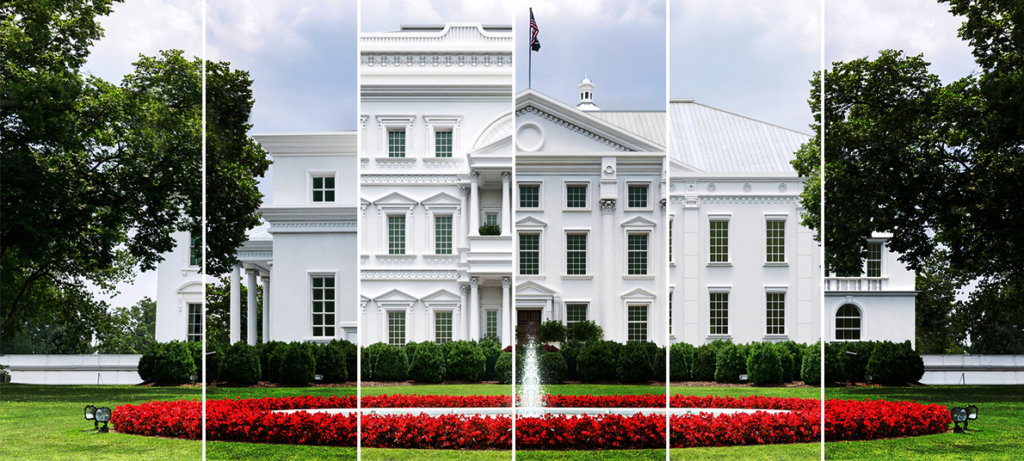
Check out this project: https://www.businessinsider.com/photos-digital-renderings-show-five-alternate-white-house-designs-2021-8
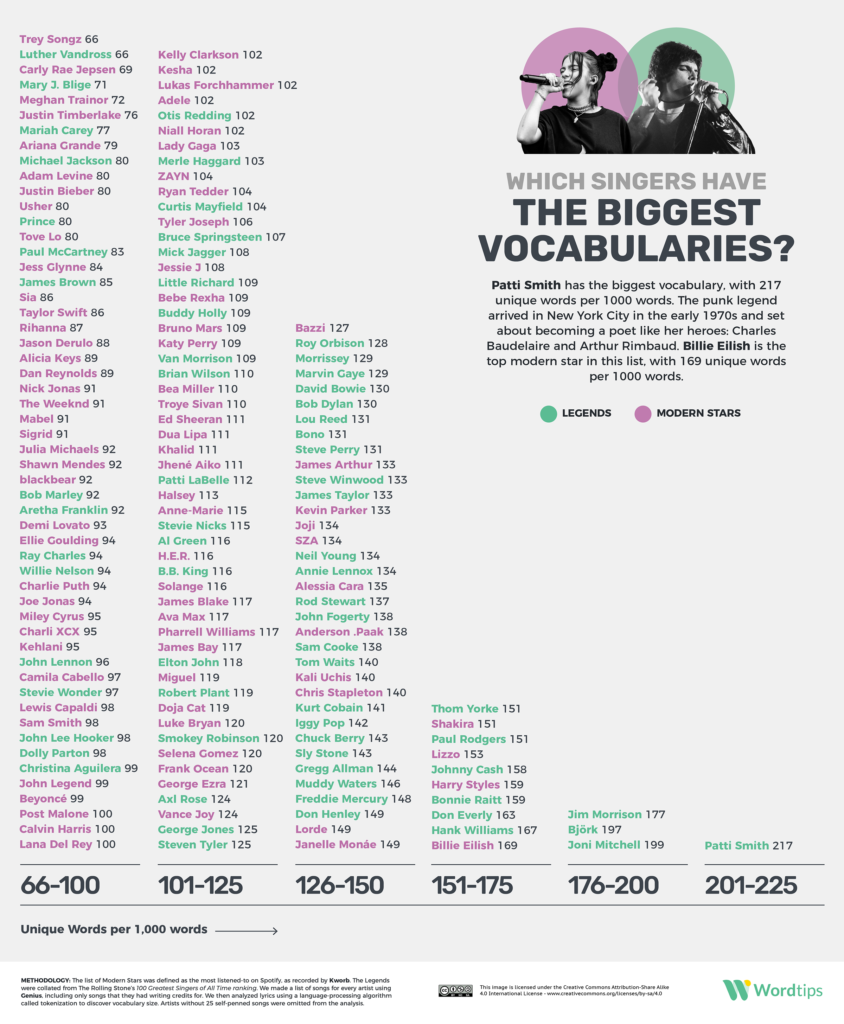
August 2021: Which Singers Have the Biggest Vocabularies?
I’m still amazed by what the team achieved with this project.
The flawless interactive dataviz would have been unthinkable to us a couple of years ago. I’m so proud of how much Nacho (our senior designer) has learned and grown since he first started working at NeoMam back in 2016. He has taken our work and the team with him, and for that I’m incredibly grateful.
So that’s one of the reasons why I’ve chosen to feature this project here:
Check out this project: https://digg.com/2021/pop-singers-sorted-by-the-size-of-their-vocabulary-visualized
The other reason why I’ve picked this one is because of the article that gives context to each of the visual assets. If you haven’t read it yet: https://word.tips/singers-vocabularies
The human behind that brilliant read is Graeme, our senior writer. It is such an honour to be able to count him as part of our team. He is one of the most talented people I’ve ever worked with.
His article was so interesting that Nick Grimshaw had a whole section of his show on August 2nd discussing Graeme’s analysis of the data. Awesome stuff.
August was the month when Amy broke the news that she will not be coming back to NeoMam after her maternity leave.
Amy moving on after nine years as a director of the business was huge. We had been talking to her about it for months so it wasn’t unexpected, but it didn’t hit us till we read the email she sent to the team
You see, Amy, Danny and I have been working as a unit for many years. We balance each other so well that thinking of a NeoMam without Amy was difficult at first. But it was also super exciting.
Amy’s life changed. And in the midst of welcoming a new human into the world, she has learned new things about herself. Moving on from NeoMam means she now has time to explore her interest in biology and her talent as a pianist.
It’s a new chapter for all of us.
September 2021: The 70-Year Evolution of the IKEA Living Room
We were ready to kill this project.
Molly had spent days sorting through 70 years worth of IKEA catalogues to shortlist each decade’s most iconic pieces of furniture and decor. But after weeks in design, the renderings just weren’t doing justice to the idea.
Enter Hanif, our multimedia designer. In his first week on the job, Povilas looped in Hanif to see if he thought he could take on the project.
The work he did blew our minds.
Check out this project: https://www.apartmenttherapy.com/70-years-ikea-living-rooms-36985212
October 2021: The Naughtiest and Best-Behaved Dog Breeds, According to Instagram
At the end of 2019, we set a company goal to build an idea generation process that didn’t rely on Danny. We implemented a few different things to get to that point, including adding ideation to the areas of responsibility of a handful of people on the team.
Two of the people who started coming up with ideas for campaigns were Lee (our senior digital PR specialist) and Luke (our head of outreach). They started their journey in ideation at the beginning of 2020, and since then they have become the engine behind a number of highly successful campaigns.
This is one of the projects that wouldn’t have been possible without them:
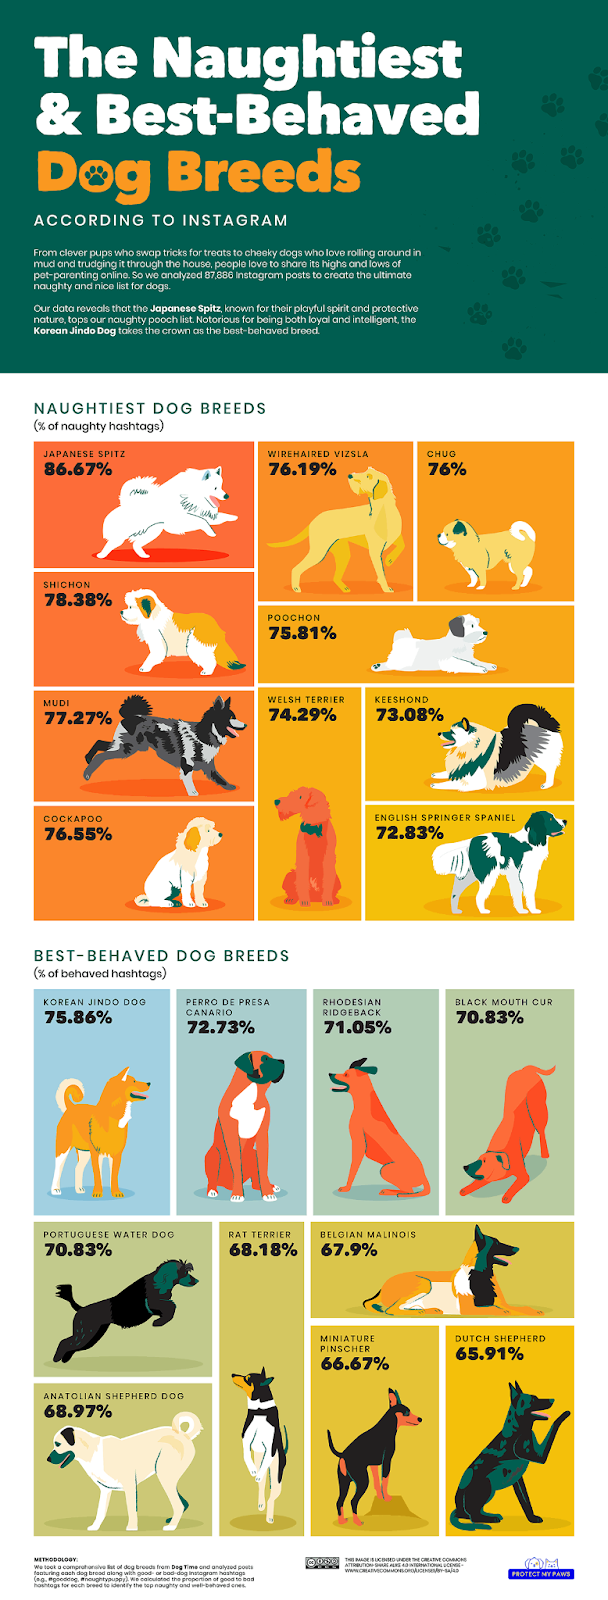
Check out this project: https://www.fatherly.com/news/family-dog-breeds/
November 2021: Get Paid $1,170 to Play With Nerf Halo Blasters
The first dream job we’ve ever worked on. It was a lot of fun, although going through a thousand applicants to pick a winner was a lot harder than anticipated.
What I love about this project is the video:
Check out this project: https://www.newsweek.com/you-can-now-get-paid-1170-test-nerf-blasters-you-get-keep-all-toys-1641600
The live footage was shot by Dan (our content lead) in England, the overlay graphics were designed by J-Lo (our junior designer) in Argentina, and the animation was done by Hanif (our multimedia designer) in Malaysia. The three of them collaborated across countries and timezones till the video was ready – including Dan composing the music from his home in Sheffield and Jaz providing creative direction from her flat in London.
When you’ve been part of a distributed team for a few years, you get used to this cross-country collaboration. But every now and again, I think about how amazing it actually is.
November 2021: The Public Toilet Index
This was one of those simple ideas that are destined to become a resource that people on the web reference for months after we’ve stopped promoting the content.
The reason this project made the retrospective is because of this link. The person behind that link is Bev, our outreach executive.
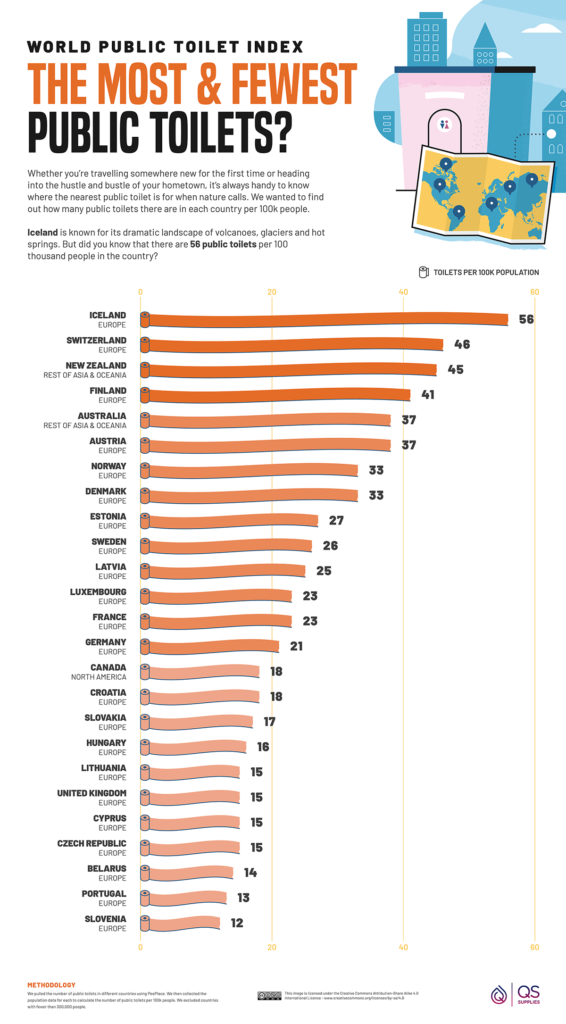
Check out this project: https://www.qssupplies.co.uk/the-public-toilet-index.html
Bev is the first person Danny hired outside of England in the early days of NeoMam. Since 2013, Bev has done it all (from drafting contracts to sales prospecting), and over time, she moved closer and closer to outreach. It has been a long journey for Bev to get to where she is, and the fact that she has worked with a journalist from Bloomberg to secure that link is proof of how amazing she is at what she does. I’m so proud of her, we all are.
December 2021: The Most Stressful Cities to Buy a Home in the US
Jess (our senior content producer) joined our team in July 2021, and since then she has gone on to write the copy for dozens of visual assets.
The tough thing about her job is that one single project will explore a topic from a multitude of angles, and she has to cover them all while delivering copy that is succinct yet engaging and interesting. What. A. Challenge.
This is one project she worked on where she had to write copy for a data visualisation, two tables, one map, and a full infographic. She nailed every single one of them, and she did so in her third month as part of the team. Absolute star.
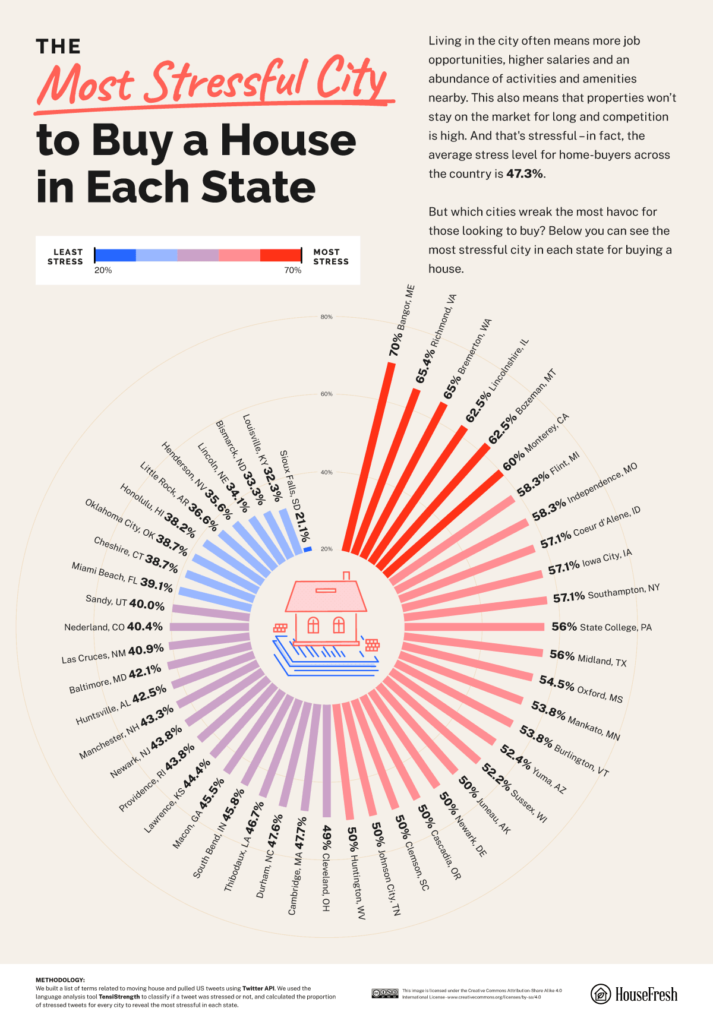
Check out this project: https://magazine.realtor/daily-news/2021/11/11/the-most-stressful-cities-to-buy-a-home
Another reason why this project is one to remember is because of what it meant for Roy, our junior outreach exec.
Roy has been promoting content for less than a year, so he’s at a point in his career where every campaign teaches him something new. This was the campaign that levelled up his US outreach skills. Whilst promoting this piece, Roy secured a link from a new US publisher or radio station nearly every day. It was beautiful to see.
December 2021: Every Country’s Favorite Toy
This project is one to remember because it is Iona’s first idea that made it all the way through to promotion.
Iona joined NeoMam as a creative in September 2021. She has breathed new life into our ideas, always pushing us to explore new approaches with content. I am lucky to have the opportunity to sit at the weekly ideation meetings with Iona, Barnes and Danny, and seeing Iona grow has been a pleasure.
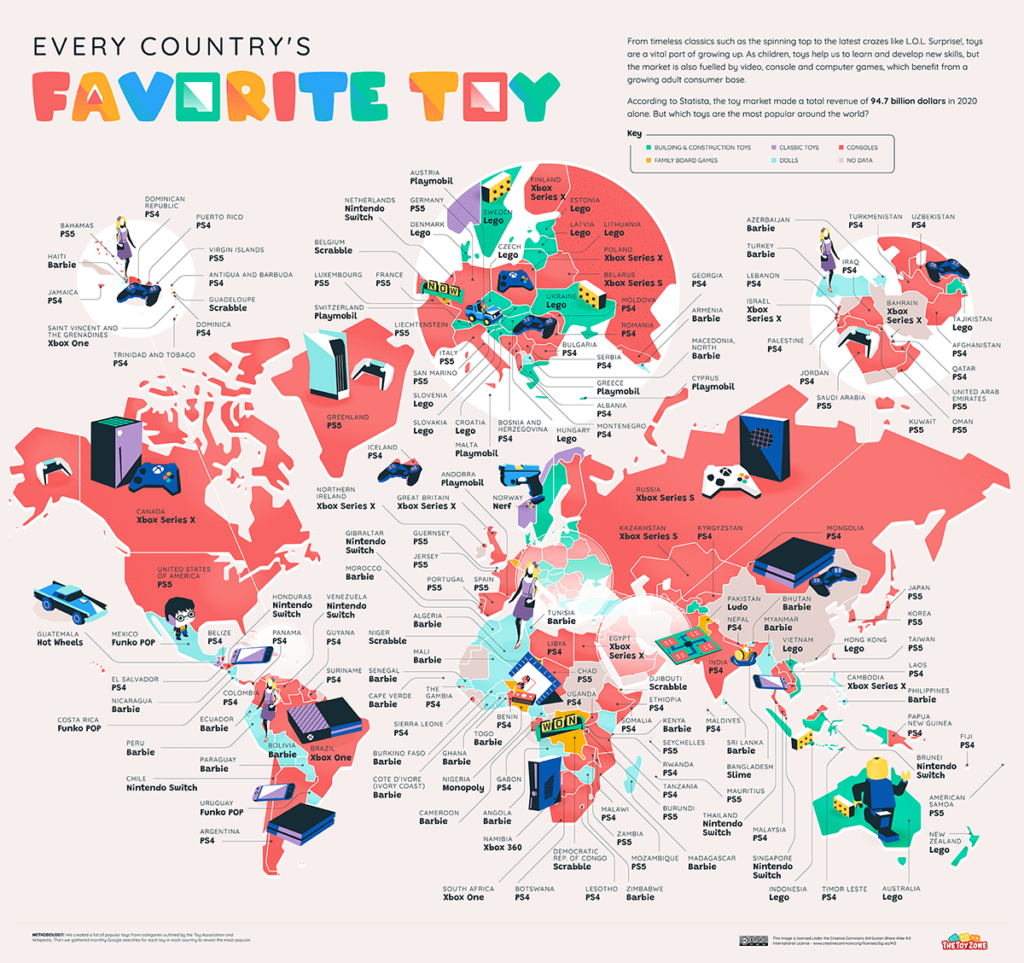
Check out this project: https://thetoyzone.com/the-most-popular-toys-in-the-world
There is another reason why this is a project to remember: it was the first time Ed worked directly with the design team as their lead. He took over the final stretch of the project, making sure the maps were the best that they could be. December was the month Ed took over the design team lead seat, and it’s been fantastic to see him transition into this role.
This was the last campaign of 2021. The team has just started promoting these maps, so it’s too soon to say if they will be the huge success we envision.
Looking back on the past 10 years
Before I conclude this post, I want to thank those who work behind the scenes: our amazing project coordinators (Karen, Flor and Rodrigo), our senior developer (Vadym), our finance manager (Cathy), our research assistant (Charlie), our proofreader (Holly), and our outreach assistant (Lui). We couldn’t have done it without your help.
I also wish to thank the long-term contractors who have become a team within a team: Ilias, Elo, Yasid, Ebnu, Andre, VK, Nic, Sam, Oleksii, Margarita, Laurentiu, and Boris. We are so lucky to have met you all.
It’s been a ride, and along the way:
- We discovered that if you remove managers from the equation, everyone is a leader.
- We learned that we should always seek clarity above all else.
- We accepted that all we care about is the work – no accolades, no awards, no exit plans.
- We started seeing people for who they are, and not for who we want them to be.
- We realised it is best for us to put learning before hiring for things that we are not good at or that we don’t understand.
- We focused on forecasting and moved away from making financial decisions by looking in the rear-view mirror.
- We stopped trying to fit into a box, and started following our instincts.
- We embraced the unexpected as an opportunity for change and improvement.
Thank you for taking the time to read this 10-year retrospective.
Here’s to the next ten years!


