The goal of this blog post is to look at 230 examples of interactive content and look at possible learnings we take from the successful and unsuccessful.
A few things worth mentioning before getting into the meat of the list:
- The list has been researched by myself and so is heavily biased in favor of my experience of the web. Please shout if I have missed your super viral interactive.
- I have removed any content from any big name publishers, such as The New York Times, Guardian and the Economist. These large publishers all have a pre-existing audience and so the share/referring domain figures will be biased in their favour.
- The referring domains figure will benefit older content versus newer content
- The list is heavily in favour of agencies who share their work publicly so if you want me to include your work in the list then don’t hesitate to get in touch.
This blog post will look in detail at 10 successful and unsuccessful examples from the list and provide 6 lessons to keep in mind when you’re creating interactive content in 2016.
Feel free to view the full list of 230 here: https://goo.gl/MRW1LX
Here’s a graph of all interactives analysed against the number of referring domains achieved:
Lesson 1: Interactive Does Not Equal Success
In our experience, a minimum of 50 referring domains is a result we agree would outweigh the additional budget to creating something interactive. What is interesting, is that only 40% actually achieve this figure. Over 30% got less than 10 referring domains.
Content is becoming naturally harder to acheive links. A study from Buzzsumo of 1 million articles showing that over 75% of the articles measured had zero links.
From this small dataset it’s clear that making your content interactive does not mean that links and shares will come any easier.
So what do the high performing interactives do differently? Based on the data set I looked at, they combine an idea that people care about, provide very solid research and effective information design. The interactive elements are just the cherry on the cake.
What specifics can we learn from the successful pieces?
Lesson 2: Keep it Simple
Looking at the top pieces of content on the list I was amazed at how some really simple interactive elements performed really well.
This interactive from SuperDrug produced by Fractl was a perfect example with 817 referring domains.
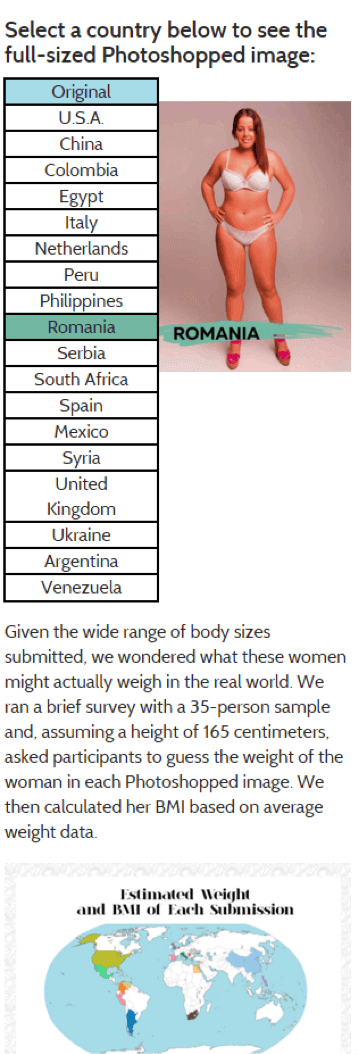
The idea for this piece was phenomenal. They took one photo of a female and asked 18 designers from around the world to touch them up in their idea of beauty.
However from an interactive point of view it’s really simple with just a selection option for each country so you can view each country without scrolling.
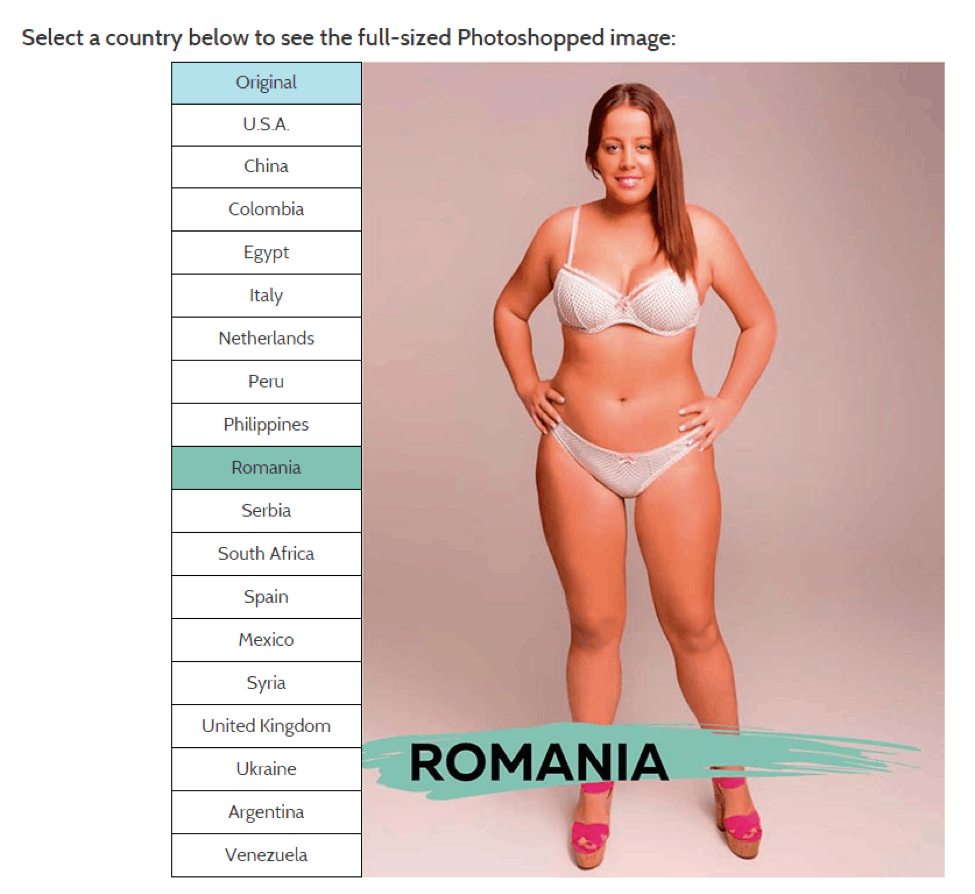
With a combination of written and visual content, this piece is the top client campaign in our unofficial study, and is one of the most simple from a development point of view.
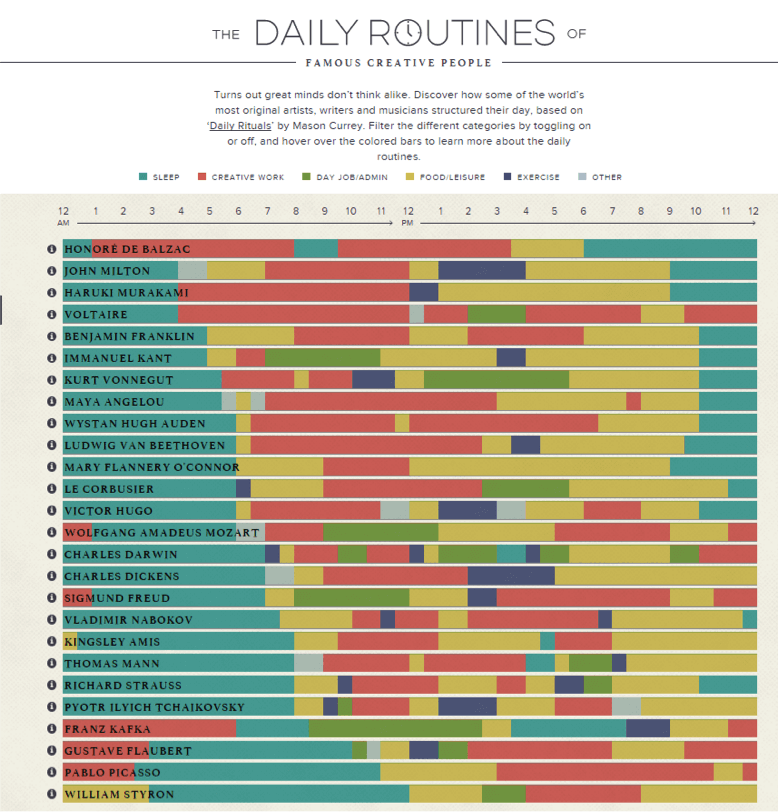
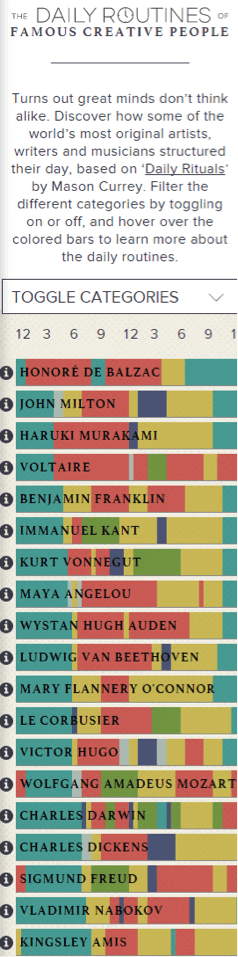
Another worthy mention is Podio’s creative routines which I believe was created by the team at Distilled and has 646 referring domains. There had obviously been intense levels of research and design but the interactive elements are just 6 tick box options that reveal sections of the design.
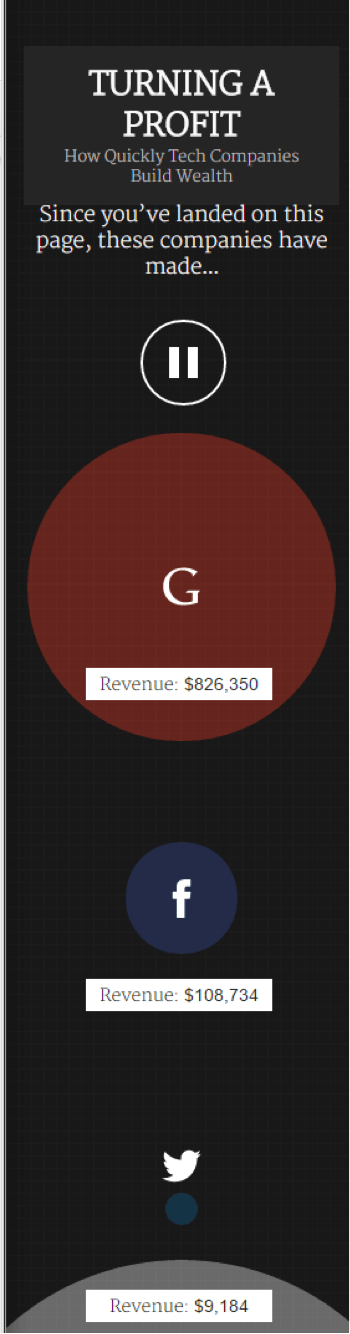
Another great example of how simplicity works is this piece from WorldPayZinc, which has 457 referring domains.
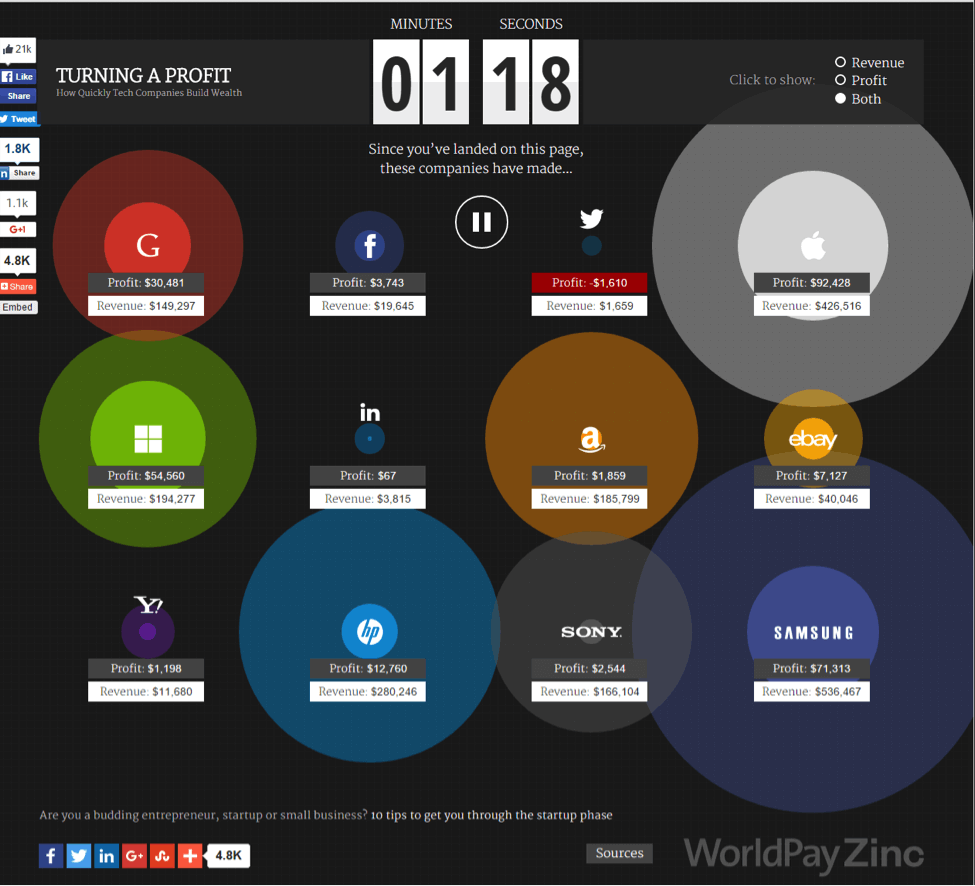
This interactive infographic utilises a timer and as the time runs down, the circles grow slowly with the corresponding increases in dollar amounts. The user has the ability to pause or select Revenue, Profit or both.
Lesson 3: It Has to be Mobile Responsive
One of the big benefits of simplicity in terms of interactivity is that it allows for the content to scale adequately to different devices as 3 of the above examples do perfectly.
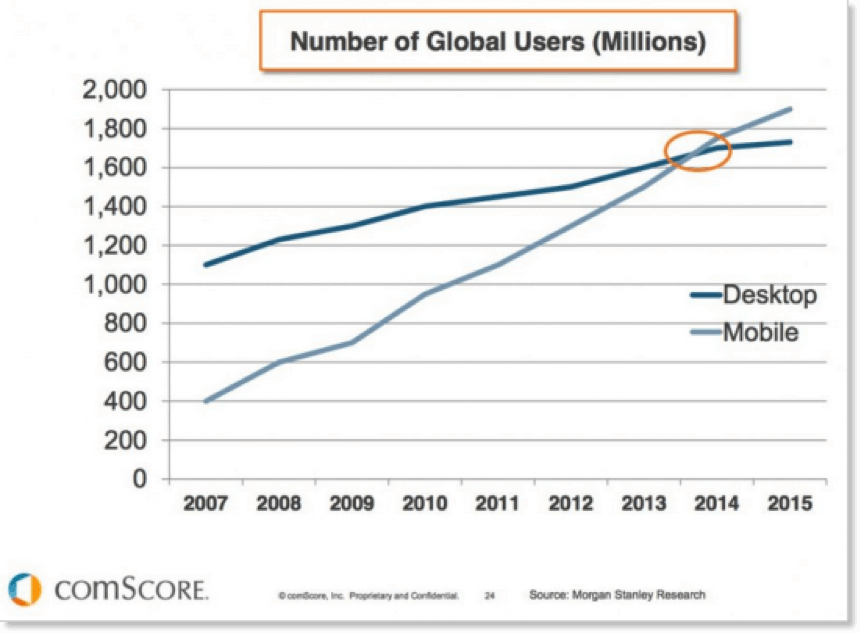
There is now more people accessing the internet on their phones compared to desktop users so your content has to be responsive on a range of mobile devices.
Lesson 4: Make Content Easy to Engage With
There are a number of interactive games in the top list including:
| Game URL | # of Referring Domains | Game details & Functionality |
| http://www.concerthotels.com/got-rhythm | 369 | Asks you to click your mouse in time to the beat. |
| https://www.justpark.com/creative/reaction-time-test/ | 442 | Click stop to measure your reaction times – I have those of a 66 year old! |
| https://www.staples.com/sbd/cre/marketing/technology-research-centers/ereaders/speed-reader/ | 299 | A test for calculating your speed of reading |
| https://www.igame.com/eye-test/ | 254 | Colour blind test (but please don’t give your email for free spins ;))! |
All of the above games are really simple, and usually contain just one mouse click to play. All the games have the ability for replay, so users are pushed to try and beat their previous score and in most cases the ability to share their score on social media.
When you arrive on the games above, you know exactly what to do next. In comparison the games in the list that have achieved far less results are often clunky and take time to understand.
We know that users are going to have less and less time to consume content in 2016. If you plan on producing any game content then you need to make sure that your users will be able to get it instantly – otherwise they are going to bounce away to the next shiny piece of content.
What can we learn from the unsuccessful projects?
There are a number of projects on here that are just low quality/low budget but what is more interesting is the projects that are big budget/quality but still fail to get big results.
In the spirit of fairness I made sure to include one NeoMam project so I don’t look to be picking on any particular competitor.
Lesson 5: User Experience Testing Needs to be Part of the Process
The first interactive I want to look at is a quiz from Clarity Way named ‘What kind of drinker are you?’, which as of today has achieved a total of 8 referring domains after promotion – looking at the backlinks, it seems clear that the interactive was promoted in some way.
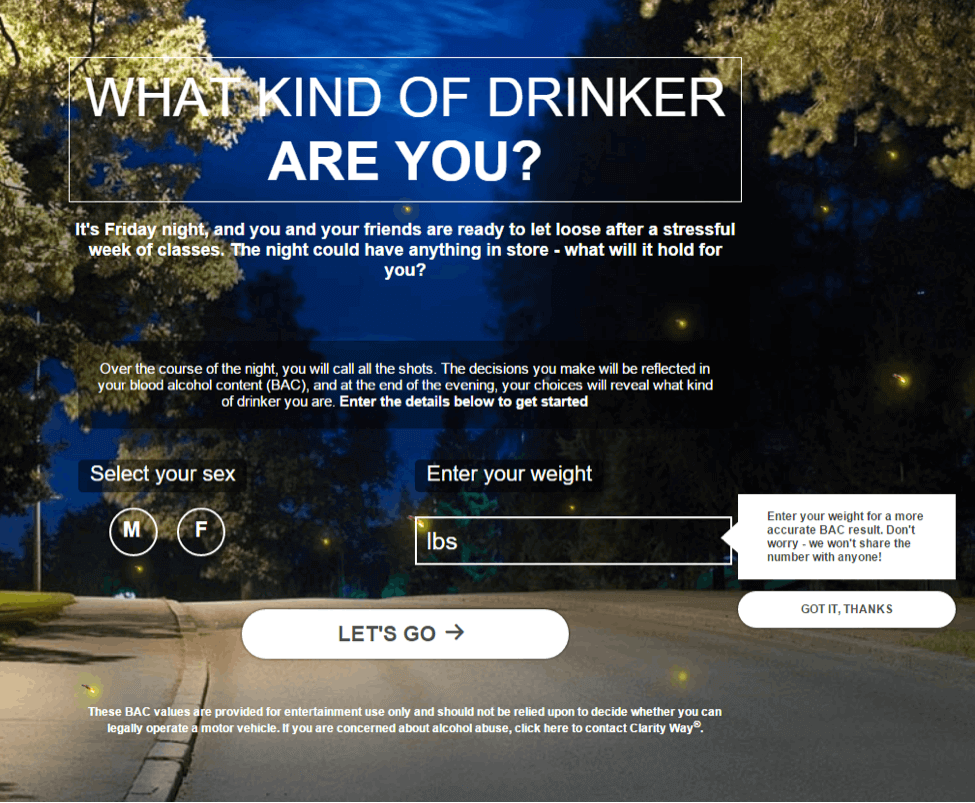
The idea itself seems pretty interesting and the design is not bad looking at all.
I believe that the content is let down by a poor user experience.
- Auto sound is on for all users, a little detail that can become an instant annoyance for everyone – journalists and influencers included.
- Your weight is asked for in Ibs, which negates many of the world speaking metric.
- There is an effect that moves the background when you move the mouse, making it hard to click the buttons effectively.
- There are sound effects with each question – again adding more to the potential annoyance.
- You are required to click a lot – 6 clicks just to get to question 2.
- It’s easy to get lost within the questions and there is no clear button to keep going.
The lesson here is that UX or user experience is as important as the development stage for interactive content. You need to make sure to test your content with as many different people/browsers/devices and get valuable, unbiased input before you release the interactive to the world.
A great tip is to use http://peek.usertesting.com/ which is a free user testing tool that provides you with a 5 minute video from a real user trying to use your interactive content.
BONUS: I actually used a free credit to get someone to review this paticular interactive campaign: http://peek.usertesting.com/result/06230910897899?autoplay=true
Lesson 6: You Still Need to Find a Topic That Matters to You and Your Audience
In this example from Hungry House (http://hungryhouse.co.uk/blog/month-of-sundays/) we have an interactive infographic that is easy to use and looks great, yet has only achieved 9 referring domains.
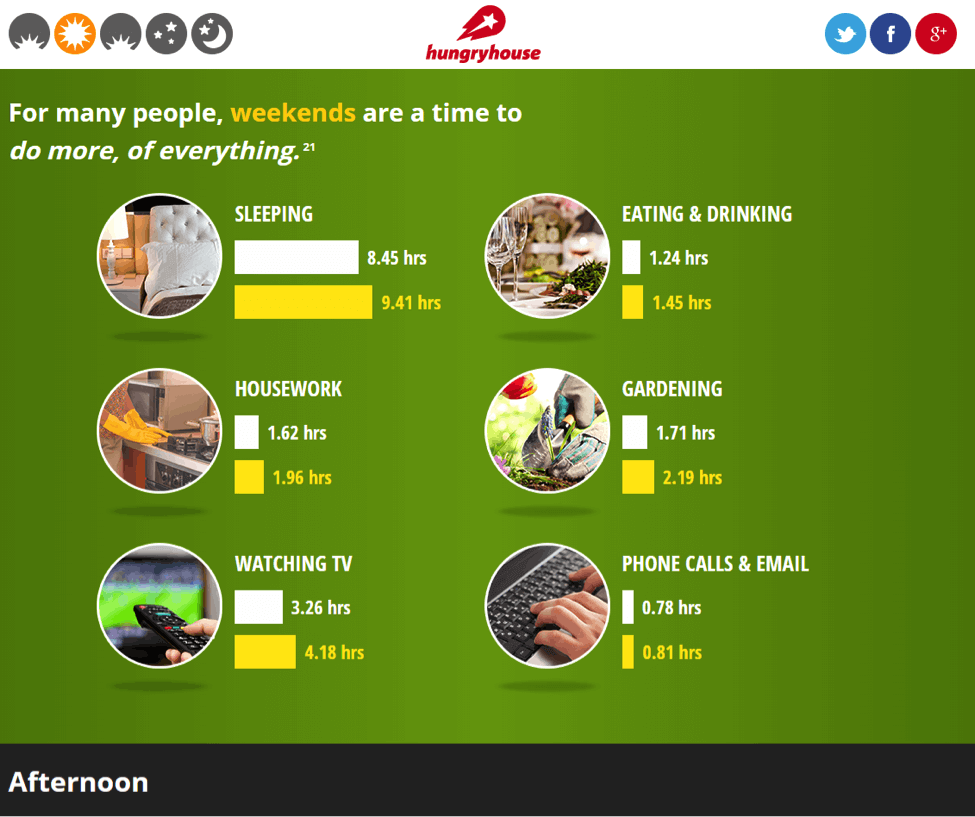
I believe the problem with this campaign is not connected to the fact that it’s an interactive piece – it would be the same if we were talking about a static data visualisation.
The issue here is that the idea is very much based around what the company wants to talk about and not much about what their audience is interested in. I’ve written in detail about this problem and how to overcome it here.
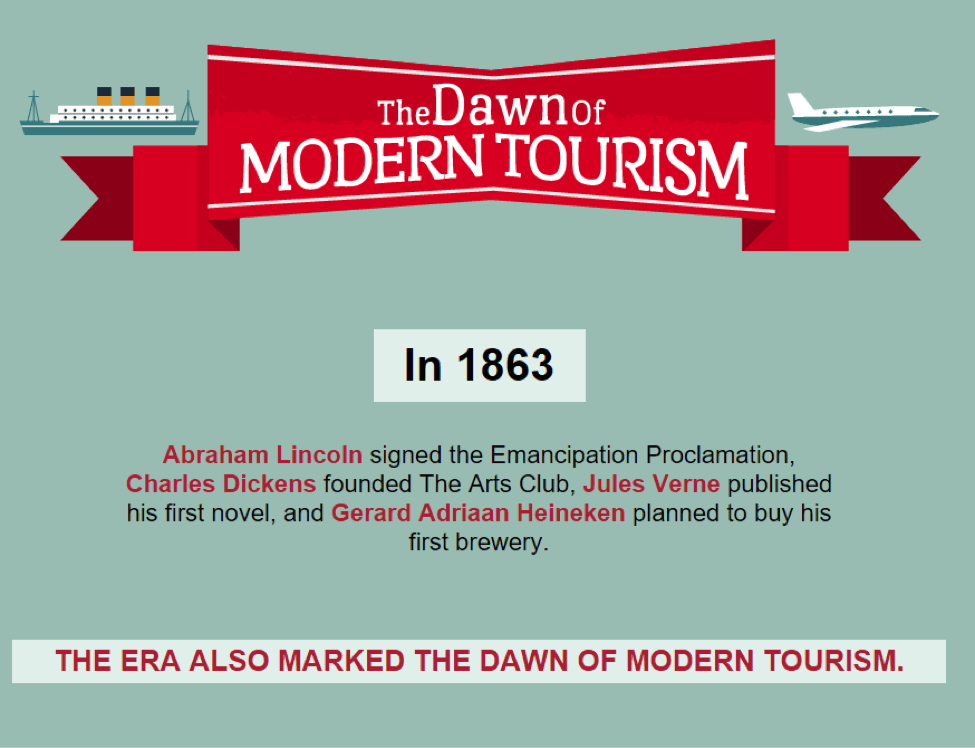
Another great looking and well developed interactive that supports this lesson belongs to Hotel Club: 150 years of travel (3 referring domains). Again I believe the idea is something that very much supports the brand’s thought leadership in the travel sector but has an unclear audience to target once the promotion stage starts.
A tip for overcoming this issue is to keep asking “Who will we reach out to once this campaign is complete?”
If you’re finding it hard to quickly to answer this question, you may be creating something that you and the client love but that the rest of Internet feels neutral about.
Conclusion (a.k.a. TL;DR)

This research is just part of the process we are taking at NeoMam to look at improving our interactive offering.
This blog post just looks at 10 campaigns from this list of 234. The TL;DR of this post is as follows:
- Interactivity doesn’t equal success it’s just a format and content fundamentals still apply.
- Keep interactive elements as simple as possible.
- Mobile responsive support is a must in 2016.
- Simple and easy to understand games can work great.
- A good user experience is key for getting success. If UX is poor then you’re better of sticking with a static format. Be sure to use http://peek.usertesting.com before publishing.
- Interactive content still requires an idea that is aligned to your brand yet has a clear and active web audience. Never stop asking who will we promote this to when it’s complete.
Our experience at NeoMam is that interactive content is really hard to get right with every single campaign. It adds a whole new level of complexity to the project and whilst there is the opportunity to get massive results, there is also a great risk in making a significant investment to achieve less results than you would with a non-interactive campaign.
If you are looking to produce your first interactive infographic in 2016, I suggest you follow the learnings from this data-set and only look at interactive elements once you are getting results with static formats the majority of the time.
Interested in learning how to create infographics that get tier 1 media placements? Sign-up for my webinar on Wednesday 27th 4pm GMT/11am EST/8am PST: How to Create Infographics That Get You Results.
Photo: Alejandro Giacometti
Hi, thanks for that post. I would be highly interested in the content that you’ve skipped, that is “big name publishers, such as The New York Times, Guardian”. Can you write some day a post focused on the effectiveness of their work? By “the effectiveness” I don’t think about reaching the audience only, but also I am wondering if – in your opinion – they simply do good infographics? Are they one step forward or one step back comparing with professionals like you? Btw. have you ever thought to describe infographics in terms of rhetorics?